
Data Cleaning in Data Analytics
Why Clean Data Matters for Better Insights
Data cleaning in data analytics is the process of fixing, improving, and preparing raw data before analysis. In real world analytics, data is rarely perfect. It may contain missing values, duplicate records, spelling mistakes, wrong formats, inconsistent categories, or incorrect entries.
Clean data matters because even the best dashboards, reports, and models can produce wrong insights if the input data is poor. In simple words, bad data leads to bad decisions. That is why data cleaning is one of the most important steps in the data analytics workflow.

What is Data Cleaning?
Data cleaning is the process of identifying and correcting errors in a dataset. It helps make data accurate, consistent, complete, and ready for analysis.
A data analyst performs data cleaning to fix issues such as:
- Missing values
- Duplicate rows
- Incorrect data types
- Inconsistent formats
- Spelling mistakes
- Outliers
- Invalid entries
- Unnecessary columns
For example, if a sales dataset has customer names written as “Delhi”, “delhi”, and “DELHI”, the dashboard may treat them as different locations. Data cleaning fixes this inconsistency.
Why Data Cleaning is Important in Data Analytics
Data cleaning is important because analytics depends on data quality. If the data is inaccurate, the final insights may also be inaccurate.
- Improves Accuracy: Clean data helps analysts create accurate reports, dashboards, and summaries. If duplicate orders are not removed, total sales may appear higher than actual sales.
- Reduces Wrong Decisions: Business decisions based on dirty data can lead to wrong actions. For example, if customer data has incorrect contact details, marketing campaigns may fail to reach the right audience.
- Saves Time During Analysis: Clean and structured data is easier to analyze. Analysts spend less time fixing errors repeatedly and more time finding insights.
- Improves Dashboard Quality: Dashboards built on clean data are more reliable. Filters, KPIs, charts, and calculations work better when data is consistent.
- Supports Better Machine Learning and Forecasting: If data is messy, machine learning models and forecasts may produce weak results. Clean data improves model quality and prediction reliability.
Common Data Quality Issues
1. Missing Values
Missing values occur when important information is absent.
Example: A customer dataset may have missing age, location, or email values.
Missing values can be handled by removing records, filling with average values, using median values, or marking them as unknown depending on the situation.
2. Duplicate Records
Duplicate records happen when the same entry appears more than once.
Example: The same order ID appears twice in a sales table.
Duplicates can inflate totals and create misleading analysis.
3. Inconsistent Formatting
Data may appear in different formats.
Examples:
- Date written as 01-05-2026 and 2026/05/01
- Gender written as Male, M, male
- City written as Mumbai, mumbai, MUMBAI
Standardizing formats helps improve consistency.
4. Incorrect Data Types
Sometimes numbers are stored as text or dates are stored in the wrong format.
Example: Sales amount stored as “₹10,000” text instead of numeric value.
This can affect calculations, sorting, and visualization.
5. Outliers
Outliers are unusual values that are very different from the rest of the data.
Example: Most purchases are between ₹500 and ₹5,000, but one value is ₹5,00,000.
Outliers should be investigated before removing them because they may be errors, fraud signals, or genuine high value events.
Data Cleaning Process
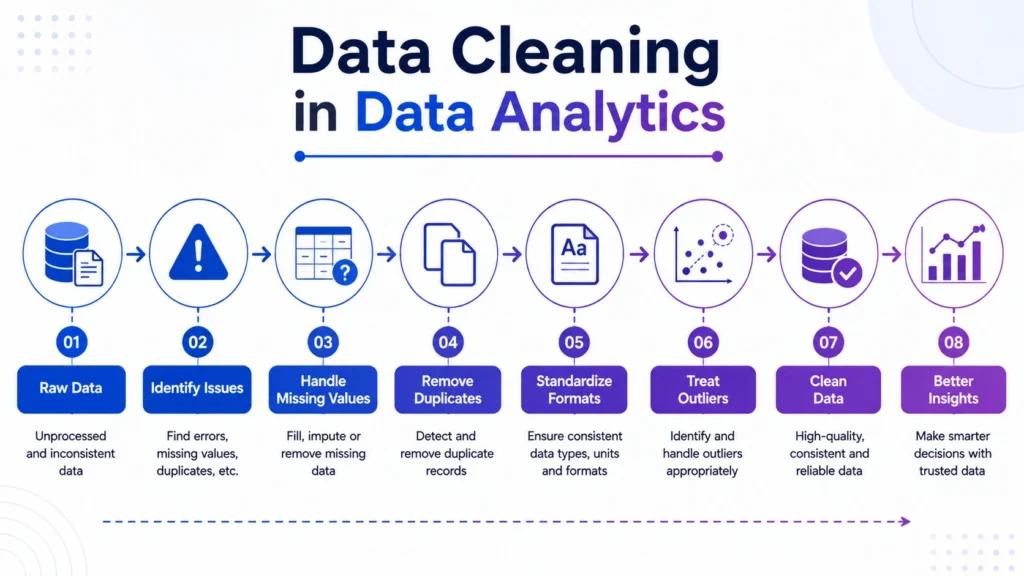
A proper data cleaning process follows a structured workflow.
1. Understand the Dataset
First, check the dataset structure, columns, data types, number of rows, and business meaning of each field.
Ask questions like:
- What does each column represent?
- Which fields are important?
- Are there missing or duplicate values?
- What business problem are we solving?
2. Identify Data Issues
Find errors such as missing values, duplicates, inconsistent categories, wrong formats, and invalid values.
Common checks include:
- Missing value count
- Duplicate row count
- Unique value count
- Data type check
- Range check
- Category consistency check
3. Handle Missing Values
Missing values can be handled in different ways.
Common methods include:
- Remove rows if missing data is very small
- Fill missing values with mean, median, or mode
- Use “Unknown” for missing categories
- Use business rules to fill values
The right method depends on the dataset and business context.
4. Remove Duplicates
Duplicate rows should be checked and removed carefully.
For example, duplicate customer records may need merging, while duplicate transaction records may need investigation.
5. Standardize Data Formats
Make data consistent.
Examples:
- Convert all dates into one format
- Standardize text case
- Fix spelling variations
- Use consistent category names
- Convert numbers into proper numeric format
6. Detect and Treat Outliers
Outliers should be reviewed before action.
You can:
- Keep them if they are valid
- Correct them if they are entry errors
- Remove them if they distort analysis
- Analyze them separately if they are important
7. Validate Cleaned Data
After cleaning, check whether the dataset still makes sense.
Validation may include:
- Checking totals
- Comparing before and after row counts
- Reviewing summary statistics
- Confirming business rules
- Checking dashboard outputs

Data Cleaning Techniques
- Removing Duplicate Data: This helps avoid double counting and improves report accuracy.
Standardizing Categories: This makes filters and dashboards cleaner.
Example: Convert “NY”, “New York”, and “new york” into one standard category.
Handling Missing Data: This improves completeness and avoids errors in analysis.
Correcting Data Types: This ensures calculations, date analysis, and sorting work correctly.
Treating Outliers: This helps prevent extreme values from misleading averages and trends.
Removing Irrelevant Columns: This keeps analysis focused and reduces unnecessary complexity.
Data Cleaning Example in Business Analytics
Suppose a retail company wants to analyze monthly sales performance. The raw data has:
- Duplicate order IDs
- Missing customer locations
- Dates in different formats
- Product categories with spelling errors
- Sales values stored as text
- A few extreme transaction amounts
If the company creates a dashboard without cleaning this data, the sales numbers, regional performance, and product trends may be wrong.
After cleaning:
- Duplicate orders are removed
- Missing locations are marked correctly
- Dates are standardized
- Product categories are fixed
- Sales values are converted into numbers
- Outliers are reviewed
Now the dashboard becomes more accurate and useful for decision making.
Data Cleaning vs Data Preprocessing
Data cleaning and data preprocessing are related, but they are not exactly the same.
| Factor | Data Cleaning | Data Preprocessing |
|---|---|---|
| Focus | Fixing errors and inconsistencies | Preparing data for analysis or modeling |
| Includes | Missing values, duplicates, formats, outliers | Cleaning, scaling, encoding, transformation |
| Used For | Better data quality | Better analytics and machine learning readiness |
| Example | Removing duplicate rows | Normalizing numerical columns |
Data cleaning is usually one important part of data preprocessing.
Data Cleaning Tools
Common tools used for data cleaning include:
- Excel for basic cleaning, filters, formulas, and duplicates
- SQL for cleaning database records and joining tables
- Python for advanced cleaning using
- Pandas
- Power Query for data transformation
- Tableau Prep for visual data preparation
- Power BI for cleaning and transforming data before reporting
Beginners can start with Excel and SQL, then move to Python and BI tools for larger datasets.
The final conclusion is that….
Data cleaning in data analytics is essential because clean data leads to better insights, accurate dashboards, reliable reports, and smarter business decisions. Before analyzing data, analysts must check missing values, duplicates, formats, outliers, and data types carefully.
For learners, data cleaning is one of the first practical skills to master. Tools like Excel, SQL, Python, Power BI, and Tableau become more useful when the data behind them is clean and reliable. In simple terms, better data quality leads to better analytics.
Data cleaning is a core skill for data analysts because every real world project starts with messy data. Career247’s Data Analytics with GenAI Course covers Excel, SQL, Python, Tableau, dashboards, statistics, real world projects, and data cleaning workflows to help learners build practical, job ready analytics skills.

Frequently Asked Questions
Answer:
Data cleaning in data analytics is the process of finding and fixing errors, missing values, duplicates, incorrect formats, and inconsistencies in raw data before analysis.
Answer:
Data cleaning is important because poor quality data can lead to wrong reports, misleading dashboards, inaccurate models, and poor business decisions.
Answer:
Common data cleaning techniques include removing duplicates, handling missing values, standardizing formats, correcting data types, treating outliers, and removing irrelevant columns.
Answer:
No. Data cleaning focuses on fixing errors, while data preprocessing includes cleaning along with transformation, encoding, scaling, and preparing data for analysis or machine learning.
Answer:
Yes, GenAI can suggest cleaning steps, explain errors, generate Python or SQL cleaning logic, and help document the process. However, analysts must validate the results carefully.

