
A/B Testing in Data Analytics
Practicing A/B testing
A/B testing in data analytics is a method used to compare two versions of something to find out which one performs better. Businesses use A/B testing to test landing pages, email campaigns, advertisements, product designs, pricing, call to action buttons, and customer experiences.

What is A/B Testing?
A/B testing is an experiment where two versions are compared:
- Version A: Original version
- Version B: New or changed version
A selected audience is split into two groups. One group sees Version A, and the other group sees Version B. Then the business compares results using metrics like conversion rate, click through rate, sales, sign ups, or engagement.
Example: A company tests two email subject lines:
- Subject Line A: “Get 20% Off Today”
- Subject Line B: “Your Special Discount is Waiting”
The company checks which subject line gets more opens or conversions.
Why A/B Testing is Important in Data Analytics
A/B testing is important because it helps businesses make decisions using real user behavior. It reduces guesswork and improves confidence in business changes.
A/B testing is useful for:
- Improving conversion rates
- Comparing marketing campaigns
- Testing website changes
- Improving user experience
- Optimizing product features
- Measuring customer response
- Validating business decisions
It is closely connected with hypothesis testing because businesses are usually testing whether one version performs better than another.
How A/B Testing Works
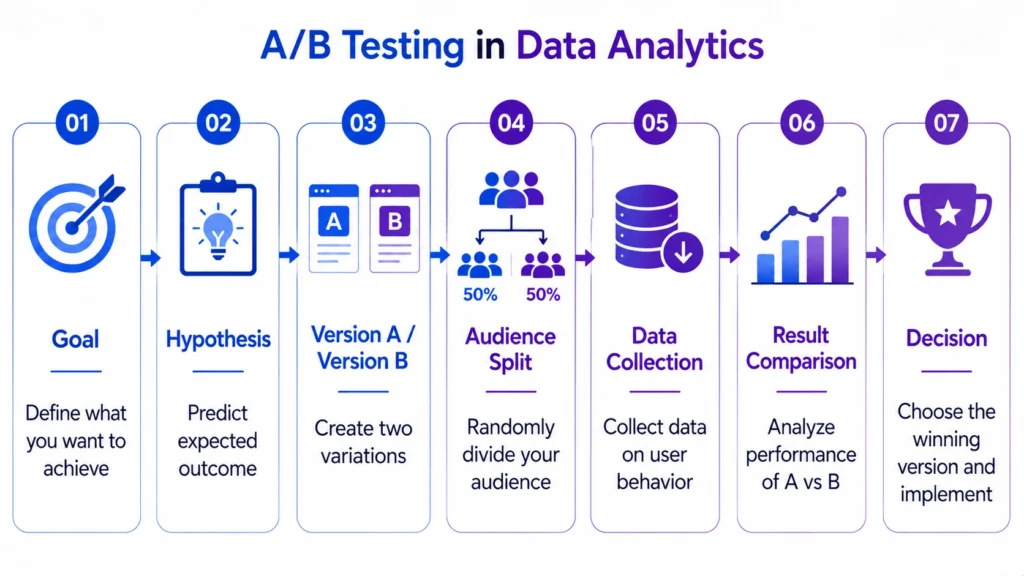
1. Define the Goal
Start with a clear goal.
Example:
- Increase sign ups
- Improve email open rate
- Increase sales
- Reduce cart abandonment
- Improve button clicks
2. Create a Hypothesis
A hypothesis is the assumption being tested.
Example: “Changing the CTA button from ‘Submit’ to ‘Get Started’ will increase conversions.”
3. Create Two Versions
- Version A is the original version.
- Version B is the changed version.
Example:
- Version A: Blue button
- Version B: Green button
4. Split the Audience
The audience is divided into two similar groups. One group sees Version A, and the other sees Version B.
5. Collect Data
Track performance using a relevant metric.
Common metrics include:
- Conversion rate
- Click through rate
- Revenue
- Sign ups
- Bounce rate
- Engagement rate
6. Compare Results
After enough data is collected, compare both versions. Use statistical testing to check whether the result is meaningful.
7. Make a Decision
If Version B performs significantly better, the business may adopt it. If not, the original version may remain.
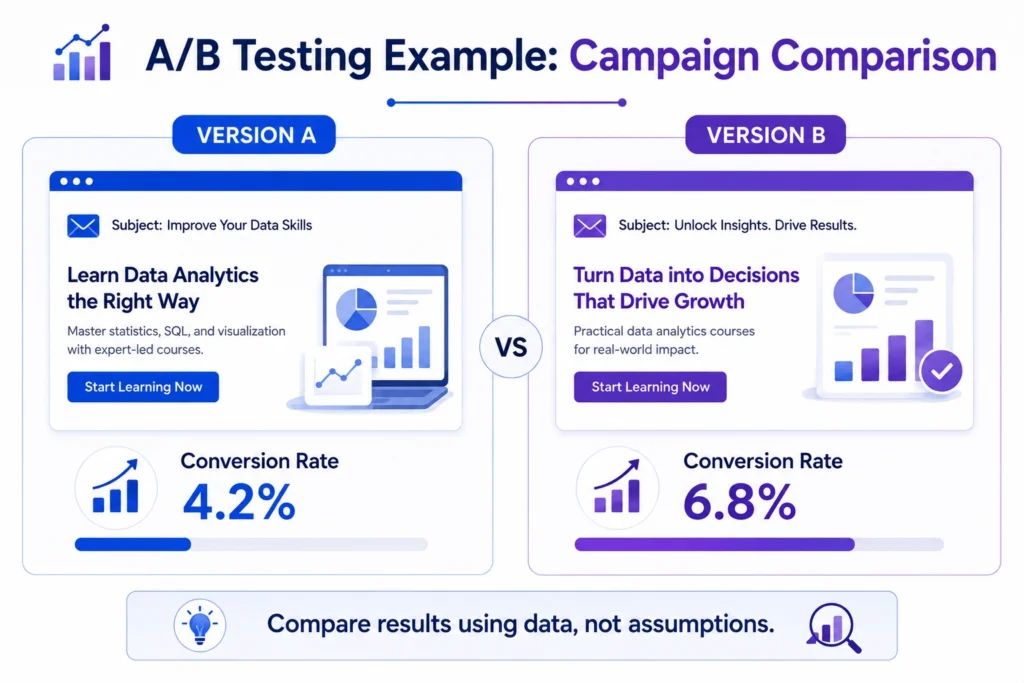
A/B Testing Example in Marketing
Suppose a company wants to improve landing page conversions.
- Version A has this headline:
“Learn Data Analytics Online” - Version B has this headline:
“Become a Job-Ready Data Analyst”
After running the test:
- Version A conversion rate: 6%
- Version B conversion rate: 8%
Version B looks better. But before making a final decision, analysts should check whether the difference is statistically significant and whether the sample size is enough.
This is where data analytics and hypothesis testing become important.
Common A/B Testing Use Cases
- Email Campaign Testing: Businesses test subject lines, email copy, send time, and call to action buttons.
- Landing Page Testing: Teams compare headlines, forms, layout, images, and CTA buttons.
- Advertisement Testing: Marketers test ad copy, creatives, audience segments, and offers.
- Product Feature Testing: Product teams test new features, interface changes, or onboarding flows.
- Pricing Testing: Businesses may test different pricing displays, discount formats, or offer structures.

Important Metrics in A/B Testing
1. Conversion Rate
Conversion rate shows the percentage of users who complete the desired action.
Example: Sign-up, purchase, download, or form submission.
2. Click Through Rate
Click through rate shows how many users clicked a link, button, or ad.
3. Bounce Rate
Bounce rate shows how many users left without taking action.
4. Revenue Per User
This helps measure whether a version not only gets clicks but also generates revenue.
5. Engagement Rate
This measures how users interact with content, features, or campaigns.
A/B Testing and Hypothesis Testing
A/B testing and hypothesis testing are closely connected.
In A/B testing:
- Null hypothesis: Both versions perform the same.
- Alternative hypothesis: One version performs better.
For example:
Null hypothesis:
- There is no difference between Landing Page A and Landing Page B.
Alternative hypothesis:
- Landing Page B has a higher conversion rate than Landing Page A.
This helps analysts make decisions based on statistical evidence, not only visible percentage differences.
Benefits of A/B Testing for Businesses
A/B testing helps businesses:
- Improve conversion rates
- Reduce decision making risk
- Understand customer behavior
- Optimize campaigns
- Improve website experience
- Validate ideas before full rollout
- Increase marketing ROI
It is especially useful because small changes can sometimes create measurable business impact.
The final conclusion is that….
A/B testing in data analytics helps businesses compare options and make better decisions using real data. It is widely used in marketing, product development, website optimization, pricing, and customer experience improvement.
For beginners, the key idea is simple:
- Create two versions, define a clear goal, collect data, compare performance, and check whether the result is meaningful.
- When done correctly, A/B testing reduces guesswork and helps businesses improve outcomes with evidence.
A/B testing is a practical application of statistics, hypothesis testing, and business decision making. Career247’s Data Analytics with GenAI Course covers statistics, Excel, SQL, Python, Tableau, dashboards, and analytics workflows that help learners understand how data supports testing, comparison, and campaign decisions in real business scenarios.

Frequently Asked Questions
Answer:
A/B testing in data analytics is a method used to compare two versions of a campaign, webpage, product feature, or message to find which performs better.
Answer:
A/B testing is important because it helps businesses make decisions based on real user behavior instead of assumptions.
Answer:
Example of A/B testing is comparing two landing page headlines to see which one generates more sign-ups or conversions.
Answer:
Common A/B testing metrics include conversion rate, click through rate, revenue per user, bounce rate, sign-ups, and engagement rate.
Answer:
A/B testing uses hypothesis testing to check whether the difference between two versions is statistically meaningful.

