
Data Visualization Tools
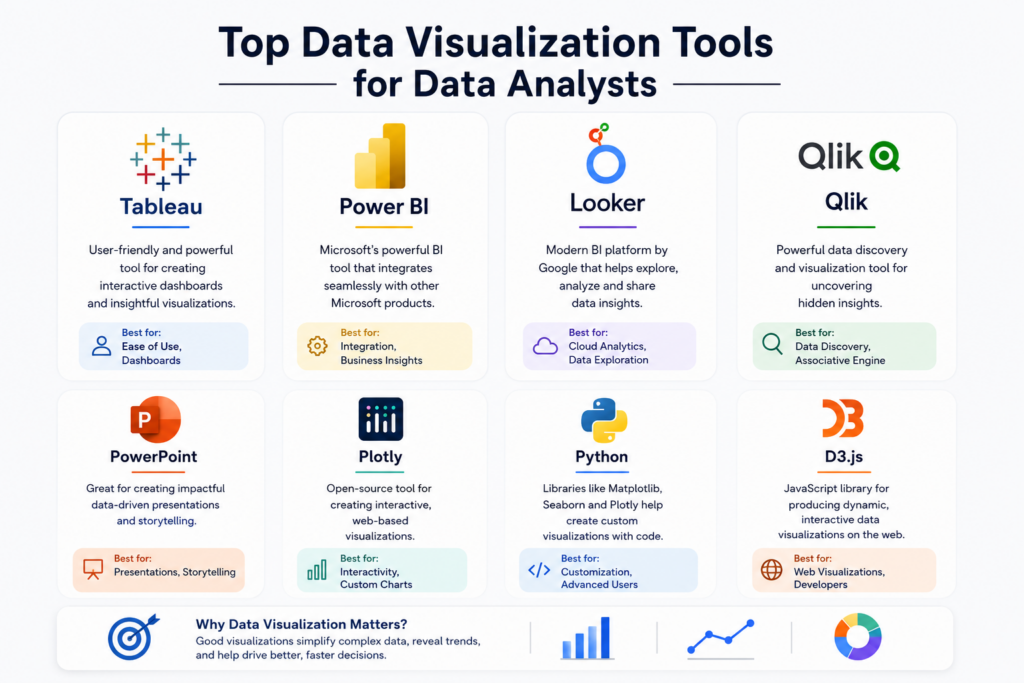
Top Data Visualization Tools for Data Analysts
In today’s data driven world, businesses rely heavily on visual reports and dashboards to make better decisions. Raw data can often be difficult to understand, but visual representation makes complex information simple and actionable. This is why learning modern Data Visualization Tools has become one of the most important skills for aspiring data analysts.
Whether you are a beginner or an experienced analyst, choosing the right visualization platform can improve reporting efficiency, data storytelling, and business insights. Companies across industries now prefer professionals who can transform large datasets into easy-to-understand charts, graphs, and dashboards.
Why Data Visualization Matters
Data visualization plays a major role in helping businesses understand and use data effectively. In today’s digital world, companies collect huge amounts of information from websites, social media, customer interactions, sales reports, and marketing campaigns. Reading raw spreadsheets and large datasets can be difficult and time consuming. Data visualization transforms this complex information into easy-to-understand charts, graphs, dashboards, and visual reports that help organizations make smarter and faster decisions.
Businesses use data visualization to quickly identify trends, compare performance, and monitor important business activities in real time. Instead of manually analyzing thousands of rows of data, decision makers can instantly understand insights through visual dashboards. This improves productivity and allows companies to respond faster to market changes and customer needs.
Data visualization is also important because it improves communication between teams and departments. Marketing teams, sales managers, finance professionals, and business analysts can all understand visual reports more easily than technical spreadsheets. This creates better collaboration and helps organizations make data driven decisions with confidence.
Key Benefits of Data Visualization
- Simplifies large and complex datasets into understandable visuals
- Helps businesses make faster and smarter decisions
- Improves communication between departments and teams
- Makes reports more engaging and easier to present
- Identifies hidden trends, patterns, and business opportunities
- Supports real-time performance monitoring
- Enhances customer behavior analysis and market research
- Reduces the time required for manual data analysis
Modern companies use data visualization across multiple industries and business operations. Marketing teams analyze campaign performance through dashboards, sales departments track revenue growth using charts, and finance teams monitor business performance with visual reports. E-commerce companies use visualization tools to study customer buying behavior, while healthcare organizations analyze patient data for better treatment planning.
Data visualization is also becoming essential in fields like artificial intelligence, machine learning, and business intelligence. As businesses continue to generate more data every day, visualization tools help convert raw information into actionable insights that drive growth and innovation.
Popular visualization formats include bar charts, pie charts, line graphs, heat maps, scatter plots, and interactive dashboards. These visuals help users understand information quickly and improve overall business efficiency. With the growing importance of data analytics, data visualization has become a critical skill for professionals and organizations worldwide.
- Poor data quality
- Choosing the wrong chart type
- Handling large datasets
- Data security concerns
- Complex dashboard design
- Real-time data integration


Best Tools Every Data Analyst Should Learn
Data visualization and reporting tools have become essential for modern businesses. These platforms help analysts convert raw data into meaningful insights, interactive dashboards, and professional reports. Learning the right visualization tools can improve career opportunities and help analysts work more efficiently across industries like finance, healthcare, marketing, retail, and technology.
1. Tableau
Tableau is one of the most popular platforms used by analysts worldwide. It offers interactive dashboards, drag and drop functionality, and powerful analytics features. The platform is widely known for transforming complex datasets into visually appealing reports that are easy to understand.
Features of Tableau:
- Easy dashboard creation
- Interactive visual reports
- Real-time analytics
- Supports large datasets
- Strong business intelligence capabilities
Many multinational companies use Tableau for executive dashboards, performance tracking, and business intelligence reporting. It is especially useful for organizations that need advanced visualization with detailed analytics.
2. Microsoft Power BI
Power BI is widely used because of its seamless integration with Microsoft products. It helps businesses create professional reports, automate data updates, and share insights across teams through cloud-based dashboards.
Why Analysts Prefer Power BI:
- User friendly interface
- Affordable for businesses
- Cloud based reporting
- AI-powered insights
- Strong Excel integration
For beginners entering analytics, Power BI is considered one of the easiest tools to learn because of its simple interface and strong community support.
3. Google Looker Studio
Google Looker Studio, previously known as Google Data Studio, is a free reporting platform that helps users create interactive dashboards and marketing reports. It is commonly used by digital marketers, SEO professionals, and website analysts.
Main Advantages:
- Completely free to use
- Connects easily with Google Analytics
- Real-time data tracking
- Easy sharing options
- Ideal for digital marketing reports
This platform is highly beneficial for businesses that rely on Google products for analytics and online campaign tracking.
4. Qlik Sense
Qlik Sense is known for its smart analytics and self-service dashboard capabilities. It allows users to explore data relationships using AI-powered suggestions and interactive visualizations.
Important Features:
- AI-assisted analytics
- Interactive dashboards
- Fast data processing
- Mobile-friendly reports
- Advanced data exploration
Large enterprises often use Qlik Sense for advanced business intelligence operations and large scale analytics projects.
5. Microsoft Excel
Even though advanced platforms are growing rapidly, Excel still remains one of the most important tools for analysts. It is widely used for organizing data, creating quick charts, and performing basic analysis.
Excel Visualization Features:
- Pivot charts
- Conditional formatting
- Basic dashboards
- Data filtering
- Formula-based analysis
Excel is often the starting point for students and beginners before moving toward advanced analytics and visualization platforms.
How to Choose the Right Visualization Tool
Choosing the right platform depends on career goals, project requirements, and business needs. Some tools are better for beginners, while others are designed for advanced analytics and enterprise-level reporting.
Consider These Factors:
- Ease of learning
- Budget and licensing cost
- Integration with databases
- Dashboard customization
- Cloud and mobile support
- Industry demand and career opportunities
Beginners can start with Excel and Power BI because they are easier to learn and widely used in companies. Advanced professionals and large organizations may prefer Tableau or Qlik Sense for deeper analytics and business intelligence capabilities.
Tips to Create Better Dashboards
A well designed dashboard helps users understand data quickly and make informed decisions without confusion. Dashboards are widely used in business intelligence, marketing analytics, sales tracking, and performance reporting. However, simply adding charts and graphs is not enough. A good dashboard should present information in a clear, organized, and visually appealing way.
Effective dashboards focus on simplicity and usability. When too much information is added, users may struggle to identify important insights. Clean layouts, proper spacing, and meaningful visual elements help improve readability and overall user experience.
Businesses use dashboards to monitor key performance indicators (KPIs), track progress, and analyze trends in real time. A professionally designed dashboard not only improves reporting efficiency but also helps teams communicate data more effectively across departments.
Best Practices for Dashboard Design:
- Use simple and consistent color combinations
- Avoid adding unnecessary charts or visuals
- Focus only on important KPIs and metrics
- Keep dashboards easy to navigate and understand
- Use proper labels, headings, and chart titles
- Highlight key insights clearly for faster decision-making
- Maintain a clean and organized layout
- Use charts that match the type of data being presented
It is also important to choose the right visualization format for the data. For example, line charts work well for trends over time, while bar charts are useful for comparisons. Pie charts should only be used for simple percentage distributions. Selecting the correct chart type improves data clarity and user understanding.
Interactive dashboards are becoming increasingly popular because they allow users to filter data, customize reports, and explore insights in real time. Tools like Tableau, Power BI, and Looker Studio provide advanced dashboard customization options for businesses and analysts.
Well designed dashboards improve business communication, increase reporting efficiency, and help organizations make data driven decisions more confidently. Clear visualization and structured reporting can significantly improve how businesses understand and use their data.
Conclusion
Visualization has become a core part of modern analytics because businesses need simple and meaningful insights from massive amounts of data. From Tableau and Power BI to Excel and Looker Studio, each platform offers unique advantages depending on business needs.
For aspiring analysts, mastering the right Data Visualization Tools can improve career growth, reporting skills, and industry opportunities. As companies continue investing in analytics, visualization expertise will remain highly valuable in the coming years.
Frequently Asked Questions
Answer:
Power BI and Microsoft Excel are considered the best options for beginners because they are easy to learn and widely used in businesses. These tools provide simple dashboard creation features and help new analysts understand reporting concepts quickly. Beginners can later move toward advanced platforms like Tableau and Qlik Sense.
Answer:
Visualization platforms help analysts convert complex datasets into easy-to-understand charts, dashboards, and reports. Businesses use these insights to make faster and smarter decisions. Good visual reports also improve communication between technical and non-technical teams.
Answer:
To learn visualization effectively, analysts should understand basic Excel, data cleaning, SQL, and dashboard design concepts. Knowledge of charts, graphs, and storytelling is also important. Strong analytical thinking helps create meaningful and accurate reports.
Answer:
Both Tableau and Power BI are powerful tools, but the best choice depends on business needs and career goals. Tableau is known for advanced visual dashboards and analytics, while Power BI is popular for affordability and Microsoft integration. Many companies use both platforms for different reporting purposes.
Answer:
Learning visualization platforms can open career opportunities such as Data Analyst, Business Intelligence Analyst, Dashboard Developer, and Reporting Specialist. Companies across healthcare, banking, retail, and IT industries actively hire professionals with dashboard and reporting skills. The demand for skilled analysts continues to grow globally.

