
Most Effective Data Analysis Techniques Used by Analysts
Most Effective Data Analysis Techniques Used by Analysts
In today’s digital world, businesses generate huge amounts of information every second. From customer behavior and website traffic to sales reports and market trends, data has become one of the most valuable business assets. However, raw data alone has little value unless it is properly analyzed and transformed into meaningful insights.
This is where data analysis techniques play an important role. Analysts use different methods to collect, organize, interpret, and visualize data so companies can make smarter business decisions. Whether it is predicting customer behavior, improving marketing campaigns, or identifying operational problems, effective data analysis techniques help organizations stay competitive.

Understanding Data Analysis Techniques
Data analysis techniques are structured methods used to collect, inspect, clean, organize, transform, and interpret data in a meaningful way. These techniques help businesses and organizations identify valuable insights hidden within large volumes of information. By analyzing data effectively, companies can understand customer behavior, improve business strategies, optimize operations, and make smarter decisions based on real evidence rather than assumptions.
In today’s digital world, businesses generate huge amounts of data from websites, mobile applications, social media platforms, online transactions, customer feedback, and internal business systems. Without proper analysis, this raw information has little value. Data analysis techniques help convert complex datasets into useful reports, visualizations, and actionable insights that support business growth and long-term success.
The primary goal of data analysis is to improve decision-making by identifying trends, patterns, relationships, and opportunities. Organizations use analytical techniques to solve business problems, reduce risks, improve efficiency, and predict future outcomes. Modern companies rely heavily on data analysis to stay competitive in rapidly changing markets.
Businesses use data analysis techniques for several important purposes, including:
- Customer behavior tracking
- Sales performance monitoring
- Marketing campaign optimization
- Financial forecasting and budgeting
- Risk assessment and fraud detection
- Operational efficiency improvements
- Product development and innovation
- Inventory and supply chain management
- Market trend analysis
- Business performance evaluation
Different industries use data analysis in different ways. For example, e-commerce companies analyze customer purchasing patterns to improve product recommendations, while healthcare organizations use data analytics to improve patient care and treatment planning. Financial institutions rely on data analysis for investment planning, fraud prevention, and credit risk management.
With the rapid growth of artificial intelligence, machine learning, and big data technologies, advanced data analysis techniques are becoming more important than ever. Businesses that effectively use data analytics can make faster decisions, improve customer experiences, increase profitability, and gain a strong competitive advantage in the market.


Top Data Analysis Techniques Used by Analysts
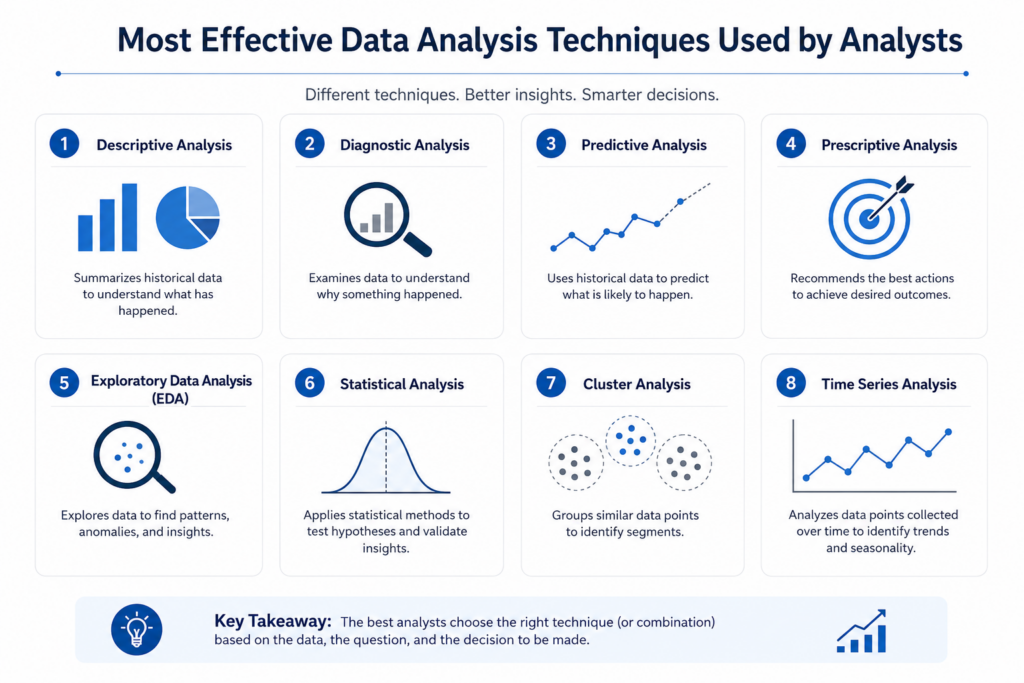
Descriptive Data Analysis
Descriptive analysis focuses on understanding past business performance. It summarizes historical data into simple reports, charts, and dashboards that are easy to understand.
This technique answers questions like:
- What happened last month?
- Which product performed best?
- How many customers visited the website?
- What was the total revenue generated?
Analysts use descriptive analytics to identify patterns and track business growth over time.
Main Advantages of Descriptive Analysis
- Simplifies large datasets
- Improves business reporting
- Helps monitor KPIs
- Supports performance tracking
- Easy to implement
Common Tools Used
- Excel
- Tableau
- Power BI
- Google Looker Studio
Descriptive analytics is often the starting point for deeper business analysis.
Diagnostic Data Analysis
Diagnostic analysis helps analysts understand the reasons behind a specific outcome or problem. Instead of only showing what happened, it explains why it happened.
For example, if website traffic suddenly drops, diagnostic analysis helps identify possible causes such as:
- SEO issues
- Technical website problems
- Reduced marketing campaigns
- Seasonal demand changes
Key Features of Diagnostic Analysis
- Root cause identification
- Trend comparison
- Relationship analysis
- Problem-solving support
Businesses use this technique to improve strategies and prevent future issues.
Predictive Data Analysis
Predictive analysis uses historical information, artificial intelligence, and statistical models to predict future outcomes.
This technique has become extremely valuable for businesses in 2026 because companies want to make proactive decisions before problems occur.
Technologies Often Used
- Python
- Machine Learning
- AI Algorithms
- Big Data Platforms
Predictive analysis helps organizations reduce risks and improve planning accuracy.
Prescriptive Data Analysis
Prescriptive analysis goes one step further than predictive analytics. It not only predicts future outcomes but also recommends the best possible actions.
This technique is commonly used in AI-powered business systems.
Examples of Prescriptive Analytics
- Dynamic pricing systems
- AI recommendation engines
- Supply chain optimization
- Automated marketing campaigns
Large organizations use prescriptive analytics to maximize efficiency and profitability.
Statistical Data Analysis
Statistical analysis is one of the oldest and most reliable data analysis techniques. It involves collecting, organizing, and interpreting numerical data using statistical methods.
Analysts use statistical analysis to identify relationships, trends, and probabilities.
Common Statistical Techniques
- Regression analysis
- Correlation analysis
- Hypothesis testing
- Probability analysis
- Variance analysis
This method is widely used in research, finance, healthcare, and business intelligence.
Exploratory Data Analysis (EDA)
Exploratory Data Analysis is used before advanced modeling begins. Analysts examine datasets to identify errors, missing values, unusual patterns, and hidden relationships.
EDA improves data quality and helps analysts understand datasets more effectively.
Popular EDA Methods
- Histograms
- Scatter plots
- Heatmaps
- Correlation matrices
- Distribution analysis
EDA plays an essential role in machine learning and predictive analytics projects.
Text and Sentiment Analysis
Modern businesses receive large amounts of text data from customer reviews, emails, surveys, and social media platforms. Text analysis helps organizations understand customer opinions and emotions.
Sentiment analysis identifies whether customer feedback is positive, negative, or neutral.
- Business Benefits
- Better customer understanding
- Improved brand monitoring
- Social media trend analysis
- Enhanced customer experience
This technique has become highly valuable for digital marketing and online reputation management.
Qualitative Data Analysis
Qualitative analysis focuses on non-numerical information such as customer experiences, interviews, observations, and opinions.
Businesses use qualitative analysis when they want deeper insights into human behavior and customer satisfaction.
- Industries Using Qualitative Analysis
- Education
- Market research
- User experience design
- Healthcare
This technique helps companies improve products and customer engagement strategies.
Quantitative Data Analysis
Quantitative analysis focuses on measurable numerical information. Analysts use mathematical calculations and statistical models to evaluate business performance.
- Common Quantitative Metrics
- Revenue growth
- Customer acquisition cost
- ROI
- Conversion rates
- Profit margins
Quantitative analysis provides objective and measurable insights for decision-making.
Data Visualization Analysis
Data visualization converts raw information into charts, dashboards, and graphical reports. This makes complex data easier to understand for both analysts and business teams.
Good visualizations improve communication and help organizations identify trends quickly.
- Popular Visualization Platforms
- Tableau
- Power BI
- Qlik Sense
- Google Looker Studio
Visualization is now considered one of the most important parts of modern analytics.
Best Tools Used for Data Analysis
Modern analysts rely on advanced software tools to process and analyze large datasets efficiently.
| Tool | Main Purpose |
|---|---|
| Microsoft Excel | Basic reporting and spreadsheet analysis |
| SQL | Database querying and management |
| Python | Machine learning and advanced analytics |
| R Programming | Statistical computing |
| Tableau | Data visualization and dashboards |
| Power BI | Business intelligence reporting |
| Google Analytics | Website traffic analysis |
| SAS | Enterprise-level analytics |
Benefits of Using Effective Data Analysis Techniques
Organizations that use advanced data analysis techniques gain a strong competitive advantage in the market.
Major Benefits Include:
- Faster business decision-making
- Improved customer targeting
- Better forecasting accuracy
- Reduced operational costs
- Increased profitability
- Enhanced marketing performance
- Smarter business strategies
Companies that ignore data analysis often struggle to compete in modern digital markets.
Future of Data Analysis in 2026
The future of data analytics is evolving rapidly with artificial intelligence and automation becoming more advanced.
- Emerging Trends in Data Analysis
- AI-powered business intelligence
- Real-time analytics
- Automated dashboards
- Cloud-based data platforms
- Predictive AI systems
- Advanced machine learning models
Businesses investing in modern analytics technologies will continue gaining long-term growth opportunities.
Final Thoughts
Data analysis has become an essential part of modern business success. Organizations rely on effective data analysis techniques to improve decision-making, understand customers, increase efficiency, and stay ahead of competitors.
From descriptive analytics and statistical analysis to predictive modeling and AI-powered insights, analysts use various methods to turn raw information into valuable business intelligence.
As businesses continue generating larger amounts of data, the demand for skilled analysts and advanced analytical techniques will continue growing in the coming years.
Frequently Asked Questions
Answer:
The most effective data analysis techniques include descriptive analysis, diagnostic analysis, predictive analysis, prescriptive analysis, and statistical analysis. These methods help analysts understand past performance, identify business problems, forecast future trends, and improve decision-making. Modern businesses use these techniques to gain valuable insights from large datasets.
Answer:
Data analysis techniques help businesses make smarter and faster decisions based on real information instead of assumptions. They improve operational efficiency, customer understanding, marketing performance, and revenue growth. Companies also use data analysis to identify market trends, reduce risks, and improve overall business strategies.
Answer:
Analysts use several tools for data analysis, including Microsoft Excel, SQL, Python, Tableau, Power BI, and R Programming. These tools help collect, organize, visualize, and analyze data efficiently. Advanced platforms also support machine learning, predictive analytics, and automated reporting.
Answer:
Descriptive analysis focuses on understanding historical data and explaining what happened in the past. Predictive analysis, on the other hand, uses historical data, AI, and statistical models to forecast future outcomes. Businesses often use predictive analysis for demand forecasting, customer behavior prediction, and risk management.
Answer:
Data visualization helps analysts present complex information in simple visual formats such as charts, graphs, and dashboards. It makes data easier to understand and helps businesses identify trends, patterns, and performance issues quickly. Effective visualization also improves communication between analysts and decision-makers.

