
Tools Used in Data Analytics
Essential Tools Used in Data Analytics for Modern Data Analysts in 2026
Data analytics continues to transform industries in 2026. Businesses now rely heavily on data-driven decisions to improve customer experiences, increase profits, optimize operations, and stay competitive in the digital market. To handle large amounts of business data effectively, professionals use various tools used in data analytics that simplify data collection, analysis, visualization, and reporting.
Modern data analysts are expected to work with multiple technologies and platforms that help convert raw data into meaningful insights. From spreadsheet software to advanced machine learning platforms, these tools play a crucial role in every stage of the analytics process.

Why Data Analytics Tools Are Important
In today’s digital world, businesses generate enormous amounts of data every second from websites, mobile applications, online purchases, social media platforms, customer interactions, marketing campaigns, and internal business operations. This raw data contains valuable insights, but without proper tools, managing and analyzing it becomes extremely difficult, time-consuming, and inefficient.
Data analytics tools play a critical role in helping organizations transform raw information into meaningful business insights. These tools simplify the process of collecting, organizing, processing, and interpreting data so companies can make smarter and faster decisions.
Modern businesses rely on analytics tools to improve efficiency, reduce operational costs, understand customer behavior, monitor performance, and stay competitive in the market. Whether it is a small startup or a large enterprise, data analytics tools help organizations handle large datasets accurately and efficiently.
Some major benefits of data analytics tools include:
1. Efficient Data Management
Analytics tools help businesses collect and organize data from multiple sources in one centralized system. This makes it easier to access, clean, and manage information without confusion or duplication.
2. Faster Data Processing
Manual data analysis can take hours or even days. Analytics tools automate calculations and data processing tasks, allowing analysts to work faster and more accurately.
3. Better Decision Making
Businesses use analytics tools to identify trends, customer preferences, and performance issues. These insights help managers and decision-makers create effective business strategies based on real data instead of assumptions.
4. Data Visualization and Reporting
Modern analytics tools provide interactive dashboards, charts, and visual reports that make complex data easier to understand. Visual representation helps teams quickly identify important patterns and business opportunities.
5. Trend and Pattern Identification
Analytics platforms can detect hidden patterns and market trends that may not be visible through manual analysis. This helps businesses predict customer behavior and improve future planning.
6. Automation of Repetitive Tasks
Data analytics tools automate repetitive activities such as report generation, data cleaning, and performance tracking. Automation saves time and increases productivity for analysts and organizations.
7. Improved Business Performance
Organizations use analytics insights to optimize operations, improve marketing campaigns, increase customer satisfaction, and enhance overall business performance.
8. Predictive and Future Analysis
Advanced analytics tools use machine learning and artificial intelligence to forecast future outcomes. Businesses can predict sales trends, customer demands, and potential risks more effectively.
9. Enhanced Accuracy
Manual analysis increases the risk of human errors. Analytics tools improve accuracy by processing large amounts of data systematically and consistently.
10. Competitive Advantage
Companies that use analytics tools effectively can make faster and smarter business decisions than competitors. This gives them a strong advantage in rapidly changing markets.
Today, industries such as healthcare, finance, e-commerce, education, marketing, and technology heavily depend on data analytics tools to improve operations and customer experiences. As organizations continue to rely on data-driven strategies, the demand for skilled professionals who understand analytics tools is growing rapidly across the world.
Learning popular data analytics tools like Excel, SQL, Python, Tableau, Power BI, and Google Analytics can open excellent career opportunities for aspiring data analysts in 2026 and beyond.
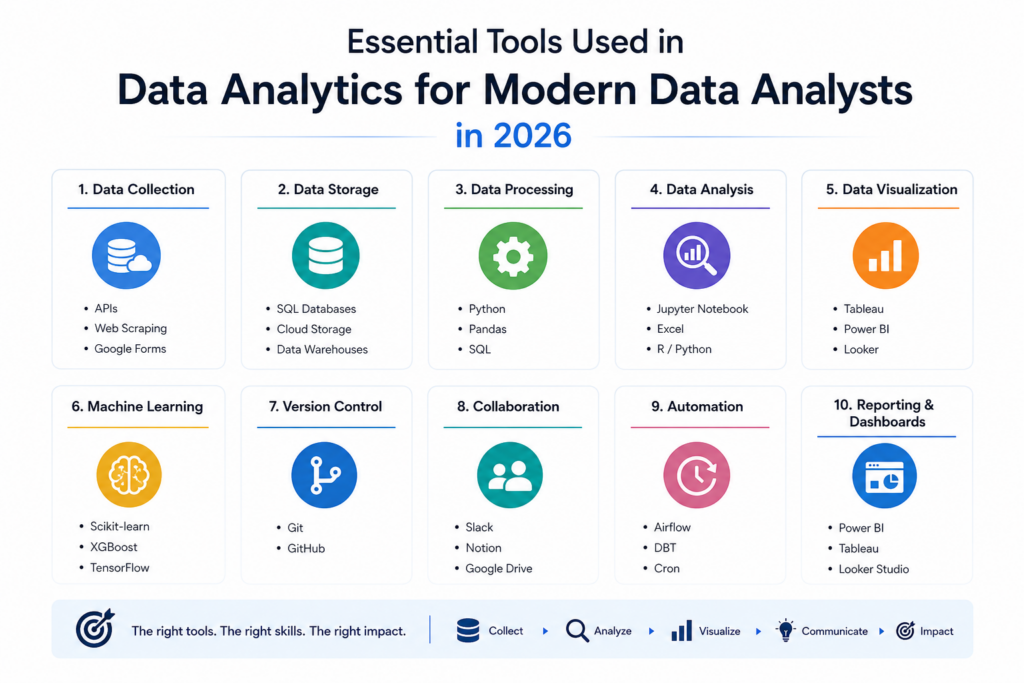


Essential Tools Used in Data Analytics in 2026
1. Microsoft Excel
Microsoft Excel remains one of the most widely used analytics tools, especially for beginners and business professionals. Despite the rise of advanced technologies, Excel continues to be essential for data handling and reporting.
- Features of Excel
- Data organization
- Pivot tables
- Charts and graphs
- Formulas and functions
- Data filtering and sorting
- Basic statistical analysis
Excel is ideal for small and medium-sized datasets and is commonly used for reporting, budgeting, and quick analysis tasks.
2. SQL (Structured Query Language)
SQL is one of the most important tools used in data analytics because most business data is stored in databases.
Why Modern Analysts Use SQL
SQL helps analysts:
- Retrieve data from databases
- Filter and sort information
- Join multiple tables
- Perform calculations
- Generate reports quickly
SQL is considered a core skill for data analysts, business analysts, and data scientists.
3. Python
Python is one of the fastest-growing programming languages in the analytics industry. Its simplicity and powerful libraries make it ideal for handling complex analytics tasks.
- Popular Python Libraries for Analytics
- Pandas
- NumPy
- Matplotlib
- Seaborn
- Scikit-learn
- Benefits of Python
- Data cleaning Automation
- Machine learning
- Predictive analytics
- Big data processing
- Advanced visualization
Python is widely used in finance, healthcare, marketing, e-commerce, and artificial intelligence projects.
4. R Programming
R is a programming language specifically designed for statistical computing and data visualization.
- Advantages of R
- Strong statistical analysis capabilities
- Advanced data visualization
- Predictive modeling
- Machine learning support
- Research and scientific computing
R is highly popular among researchers, statisticians, and academic institutions.
5. Tableau
Tableau is one of the leading business intelligence and data visualization tools used in modern analytics.
- Key Features of Tableau
- Interactive dashboards
- Drag-and-drop interface
- Real-time analytics
- Advanced data visualization
- Easy report sharing
Tableau helps businesses understand data through visually appealing charts and dashboards.
6. Power BI
Power BI is Microsoft’s business intelligence platform that allows users to create interactive reports and dashboards.
Why Power BI Is Popular in 2026
- Affordable pricing
- User-friendly interface
- Cloud integration
- Real-time reporting
- Strong Microsoft ecosystem support
Power BI is commonly used by organizations for performance tracking and business reporting.
7. Google Analytics
Google Analytics is an essential analytics tool for digital marketing and website performance tracking.
What Google Analytics Tracks
- Website visitors
- User behavior
- Traffic sources
- Conversion rates
- Customer engagement
Businesses use this tool to improve online marketing strategies and website performance.
8. Apache Spark
Apache Spark is a powerful big data processing framework used for handling massive datasets quickly and efficiently.
- Benefits of Apache Spark
- Fast data processing
- Real-time analytics
- Scalable computing
- Machine learning integration
- Big data management
Spark is widely used by large enterprises and technology companies.
9. SAS
SAS is an advanced analytics software used for statistical analysis, predictive analytics, and business intelligence.
- Common Uses of SAS
- Data mining
- Forecasting
- Risk analysis
- Business reporting
- Statistical modeling
Industries such as healthcare, banking, and insurance heavily rely on SAS for advanced analytics.
10. KNIME
KNIME is an open-source analytics platform designed for data science and machine learning workflows.
- Features of KNIME
- Visual workflow creation
- Data integration
- Automation tools
- Predictive analytics
- Machine learning support
KNIME is suitable for both beginners and experienced data professionals.
How to Choose the Right Data Analytics Tool
Choosing the right analytics tool depends on several factors, including business goals, data size, technical expertise, and budget.
Best Tools for Beginners
- Excel
- Power BI
- Google Analytics
Best Tools for Advanced Analytics
- Python
- R
- Apache Spark
- SAS
Best Visualization Tools
- Tableau
- Power BI
- Best Database Tool
- SQL
Learning multiple tools can improve career growth and increase job opportunities in data analytics.
Conclusion
The demand for professionals skilled in tools used in data analytics continues to grow rapidly in 2026. Businesses need experts who can collect, process, analyze, and visualize data effectively to support better decision-making.
From Excel and SQL to Python, Tableau, and Power BI, each tool offers unique benefits for modern data analysts. Mastering these essential tools can help professionals improve productivity, solve complex business problems, and build successful careers in the growing field of data analytics.
As technology evolves, staying updated with the latest analytics tools and trends will remain essential for long-term success.
Frequently Asked Questions
Answer:
The most commonly used tools in data analytics include Microsoft Excel, SQL, Python, Tableau, Power BI, and R Programming. These tools help analysts collect, process, visualize, and interpret data efficiently. Businesses use them to improve decision-making, identify trends, and create reports. Each tool serves different purposes depending on the complexity of the data and business requirements.
Answer:
SQL is important because it allows data analysts to access and manage information stored in databases. Analysts use SQL to retrieve specific data, filter records, combine tables, and generate reports quickly. Since most companies store their business data in databases, SQL has become one of the essential skills for modern data analysts in 2026.
Answer:
Microsoft Excel is considered one of the best tools for beginners because it is easy to learn and widely used in businesses. Beginners can use Excel for data organization, calculations, charts, and basic analysis. After learning Excel, many analysts move to advanced tools like SQL, Power BI, and Python for larger datasets and complex analytics tasks.
Answer:
Python is widely used in data analytics for data cleaning, automation, statistical analysis, machine learning, and visualization. It offers powerful libraries like Pandas, NumPy, and Matplotlib that simplify complex analytics processes. Python is especially useful for handling large datasets and building predictive analytics models used by modern businesses.
Answer:
Tableau and Power BI are popular data visualization and business intelligence tools that help analysts create interactive dashboards and reports. These tools convert complex datasets into visual charts and graphs that are easy to understand. Businesses use them to monitor performance, track KPIs, and make data-driven decisions more effectively.

