
What is Data Analysis ?
What Data Analysis is and Why is it Important for Business?
What is data analysis and why does it matter for businesses? Data analysis is the process of collecting, cleaning, organizing, and interpreting data to find useful insights. In business, data analysis helps companies understand customers, improve operations, track performance, reduce risks, and make smarter decisions.
As companies generate more data through websites, apps, sales platforms, CRMs, social media, marketing tools, and customer interactions, the ability to analyze data has become a core business requirement. Today, businesses do not just need data; they need professionals who can convert that data into clear insights and practical actions.

What is Data Analysis?
Data analysis is the process of examining raw data to discover patterns, trends, relationships, and insights. It helps convert large or complex information into meaningful conclusions that businesses can use for decision making.
In simple terms, data analysis answers questions like:
- What happened?
- Why did it happen?
- What is changing?
- Which area needs improvement?
- What action should the business take?
For example, if an e-commerce company wants to know why sales dropped last month, data analysis can help identify whether the issue came from low website traffic, poor conversion rate, product pricing, delivery delays, weak campaigns, or customer behavior changes.
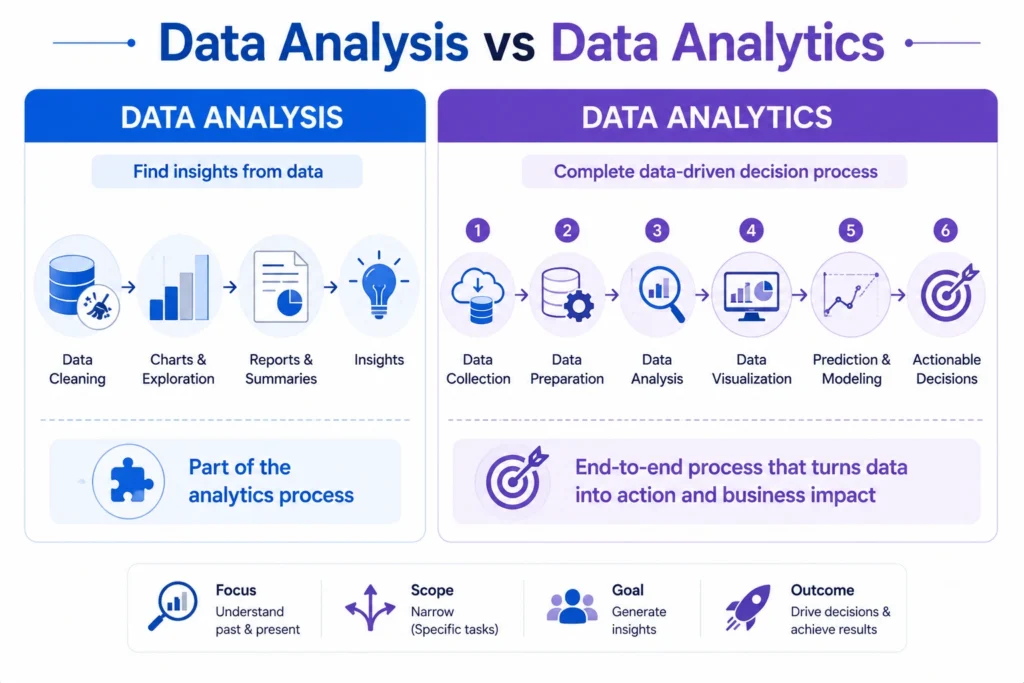
Data Analysis vs Data Analytics: How Are They Connected?
For example, when a business wants to understand why sales dropped last month, the analyst may clean the sales data, compare monthly trends, check customer segments, and prepare a dashboard. This is data analysis.
But when the full process includes collecting data from different sources, preparing it, visualizing it, forecasting future sales, and recommending actions, it becomes part of data analytics.
- This is why most data analytics courses include data analysis as a core module.
- Before learning advanced topics like predictive analytics, Tableau dashboards, or Python based automation, learners first need to understand how data analysis works.
- It builds the foundation for practical analytics skills and helps beginners understand how raw data becomes useful business insight.
Why Data Analysis is important for Businesses?
Data analysis is important for businesses because it helps leaders make decisions based on facts instead of assumptions. In a competitive market, companies cannot depend only on guesswork. They need data to understand performance, customer behavior, market changes, operational gaps, and business risks.
A business that understands its data can identify what is working, what is failing, and where improvement is needed. This makes data analysis useful for every department, including marketing, sales, finance, operations, human resources, and customer service.
Types of Data Analysis used in Business
1. Descriptive Analysis:
Descriptive analysis explains what happened in the past.
- It is commonly used for monthly sales reports, website traffic summaries, customer purchase history, revenue dashboards, and performance tracking.
- This is usually the first step in business data analysis because it gives a clear view of existing performance.
2. Diagnostic Analysis
Diagnostic analysis explains why something happened.
- For example, if sales dropped, diagnostic analysis helps identify whether the reason was weak demand, poor campaign performance, high pricing, product availability, or customer behavior changes.
- It helps businesses find the root cause behind a problem.
3. Predictive Analysis
Predictive analysis estimates what may happen in the future using historical data and trends.
- Businesses use it for future sales forecasts, customer churn prediction, demand forecasting, and risk prediction.
- This type of analysis is becoming more important as companies adopt AI, automation, and advanced analytics.
4. Prescriptive Analysis
Prescriptive analysis suggests what action should be taken based on available data and expected outcomes.
- It helps businesses decide which product to promote, which customer group to target, which cost area to reduce, or which strategy may produce better results.
- It supports smarter and more strategic decision-making.


Data Analysis Process for Businesses
A proper data analysis process usually follows a structured workflow.
1. Define the Business Problem
The first step is identifying the question or problem.
Examples:
- Why are sales decreasing?
- Which marketing campaign performed best?
- Which region has the highest profit?
- Which customers are likely to leave?
A clear problem statement helps guide the entire analysis.
2. Collect Relevant Data
Data can come from different sources, such as:
- Sales reports
- CRM systems
- Website analytics
- Social media platforms
- Customer surveys
- Excel sheets
- Databases
- Business dashboards
The quality of data directly affects the quality of insights.
3. Clean and Prepare Data
Raw data often contains missing values, duplicate entries, incorrect formats, and inconsistent records. Data cleaning ensures that the dataset is reliable.
This step may include:
- Removing duplicates
- Fixing incorrect values
- Handling missing data
- Standardizing formats
- Combining multiple datasets
Clean data leads to more accurate analysis.
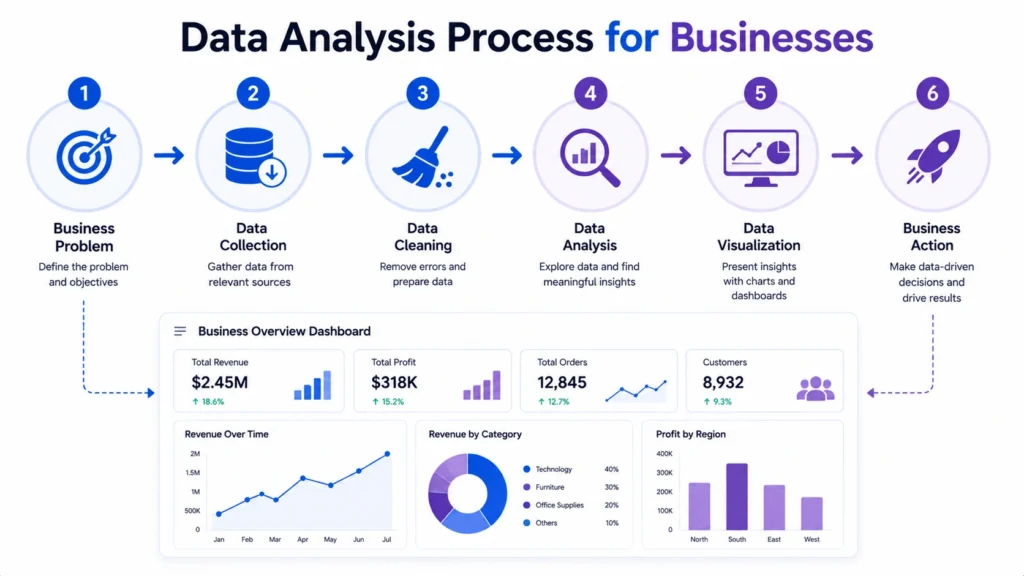
4. Analyze the Data
Once the data is clean, analysts use different methods to find patterns and insights.
Common techniques include:
- Descriptive analysis
- Comparative analysis
- Trend analysis
- Correlation analysis
- Segmentation
- Forecasting
This is where raw data starts becoming meaningful.
5. Visualize the Insights
Visualization helps make insights easier to understand. Tools like Excel, Power BI, Tableau, and Python libraries are used to create charts, dashboards, and reports.
Common visuals include:
- Bar and Line charts
- Pie charts
- Heat maps
- KPI cards
- Dashboards
A good visualization helps business users understand insights quickly.
6. Take Business Action
The final step is using insights to make decisions.
For example:
- Improve pricing strategy
- Launch a targeted campaign
- Reduce unnecessary costs
- Improve customer service
- Optimize inventory planning
Data analysis becomes valuable only when it leads to action.
Benefits of Data Analysis for Businesses
1. Better Decision Making
- Data analysis helps businesses make informed decisions using real numbers, customer behavior, sales performance, and market trends.
- Instead of depending only on opinions, companies can use data to decide which products to promote, which regions need attention, and which customer segments are most profitable.
2. Improved Customer Understanding
Businesses use data analysis to understand customer needs, preferences, and buying behavior.
- It helps identify most purchased products, customer retention patterns, customer lifetime value, popular buying channels, and feedback trends.
- These insights help companies improve customer experience and create better marketing strategies.
3. Increased Revenue Opportunities
- Data analysis helps businesses discover new revenue opportunities by studying product performance, campaign results, sales trends, and customer demand.
- For example, if data shows that a specific product sells more during festive seasons, the business can plan inventory, pricing, and promotions in advance.
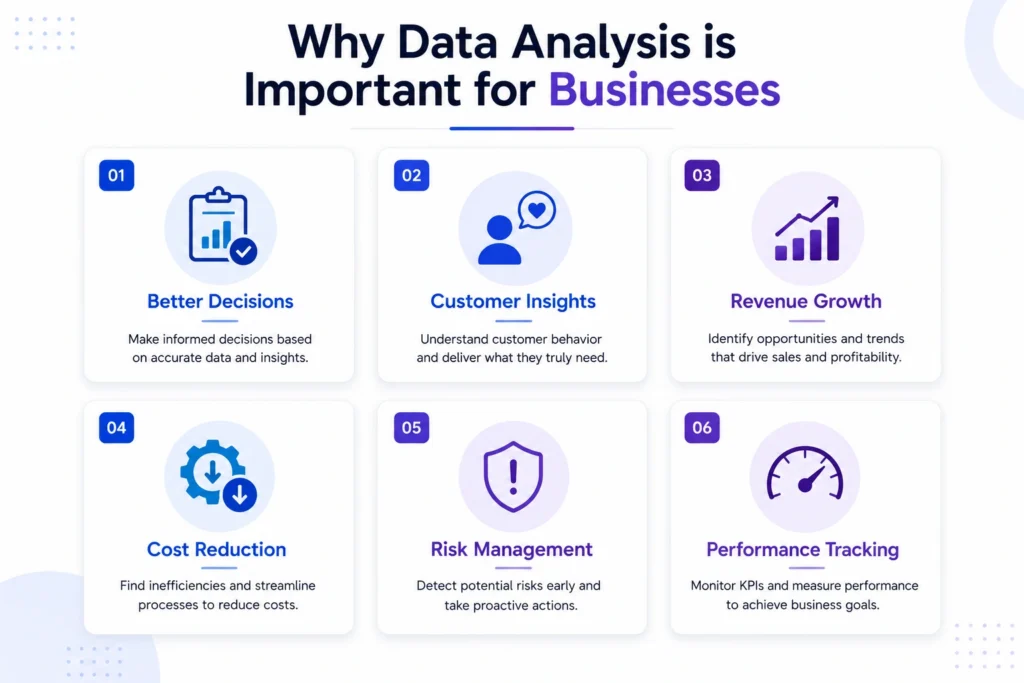
4. Cost Reduction
- Data analysis helps reduce unnecessary costs by identifying inefficiencies in operations, marketing, supply chain, and staffing.
- Businesses can reduce inventory waste, improve resource planning, identify low performing campaigns, and remove delays that affect profitability.
5. Better Risk Management
Every business faces risks such as fraud, customer churn, financial loss, operational delays, and sudden market changes.
- Data analysis helps detect unusual patterns and warning signs early.
- For example, banks use transaction analysis to identify suspicious activity, while retail companies use data to predict stock shortages or demand changes.
6. Stronger Business Performance Tracking
- Data analysis helps businesses track key performance indicators such as revenue, profit margin, conversion rate, website traffic, customer acquisition cost, sales growth, and customer satisfaction score.
- Tracking these KPIs helps businesses understand whether they are moving in the right direction.
Benefits of Data Analysis for Businesses:
Skills Required for Business Data Analysis
To perform business data analysis effectively, learners need the right combination of tools and skills. Tools help in collecting, processing, analyzing, and visualizing data, while skills help in interpreting the results and communicating insights clearly.
Common data analysis tools include:
- Excel for basic reporting and calculations
- SQL for database querying
- Python for advanced analysis and automation
- Power BI and Tableau for dashboards and visualization
- Google Analytics for website data, and CRM tools for customer insights.
Along with tools, learners need strong data analysis skills such as logical thinking, pattern recognition, problem solving, data interpretation, dashboard creation, basic statistics, and business understanding.
Note: Communication is also important because a data analyst must explain insights clearly to non technical teams.
In simple terms, tools help you work with data, but analytical and communication skills help you turn that data into business decisions.
Learning Data Analysis Practically with Career247
For learners who want to move beyond theory, a structured learning path can make the process easier. Career247’s Data Analytics Course is designed to help beginners learn data analysis through practical tools, real world projects, dashboards, and guided workflows.
The course focuses on important skills such as Excel, SQL, Python, Tableau, data visualization, and business analytics. Since Career247’s Data Analytics Course is IBM and NASSCOM certified, it also adds professional credibility while helping learners build job ready analytics skills through hands on practice.
This makes it useful for students, freshers, and working professionals who want to understand data analysis as part of the broader data analytics career path.
Why Businesses Need Data Analysts
Businesses need data analysts because data is useful only when someone can interpret it correctly. A data analyst helps companies understand performance, identify problems, and find opportunities.
A data analyst usually works on:
- Cleaning data
- Preparing reports
- Creating dashboards
- Finding trends
- Explaining insights
- Supporting decision making
As more businesses adopt digital platforms, automation, AI tools, and dashboard based reporting, the need for analytics professionals continues to grow.
So the conclusion is that….
Data analysis is one of the most important business skills in today’s digital world.
- It helps companies understand what is happening, why it is happening, and what actions should be taken.
- From marketing and sales to finance, operations, and customer service, data analysis supports smarter decisions across every business function.
- It is also a core part of data analytics, which means anyone planning to build a career in analytics must first understand how data analysis works. For businesses, it improves performance, reduces risk, and creates better growth opportunities.
For learners, it opens the door to roles in data analytics, business intelligence, reporting, and decision making. As companies continue to rely on data, learning data analysis is becoming a practical and future ready skill.
Frequently Asked Questions
Answer:
Data analysis is the process of studying data to find useful insights, patterns, and trends. It helps businesses understand performance, solve problems, and make better decisions.
Answer:
Data analysis is important because it helps businesses improve decision making, understand customers, reduce costs, increase revenue, manage risks, and track performance.
Answer:
Data analysis focuses on examining data to find insights, while data analytics is a broader field that includes data collection, preparation, analysis, visualization, prediction, and decision making.
Answer:
The main types of data analysis are descriptive, diagnostic, predictive, and prescriptive analysis.
Answer:
Common data analysis tools include Excel, SQL, Python, Power BI, Tableau, Google Analytics, and CRM platforms.
Answer:
Yes, small businesses can use data analysis to track sales, understand customers, improve marketing, manage expenses, and make better decisions.
Answer:
Beginners can start with Excel, SQL, basic statistics, and data visualization. After that, they can learn Python, Tableau, Power BI, and real world analytics projects.

