
Python Data Analysis
Python Data Analysis Techniques for Beginners and Professionals
Python Data Analysis is a modern approach to collecting, organizing, analyzing, and visualizing data using Python programming techniques. It helps beginners understand data structures and enables professionals to build advanced analytical workflows for business intelligence, forecasting, and automation. With powerful libraries and simple syntax, Python has become one of the most preferred technologies for data analytics across multiple industries.

Introduction to Python Data Analysis
Data plays a major role in modern decision-making. Organizations, researchers, and analysts rely on accurate insights to improve performance, understand trends, and solve problems efficiently. This is why Python Data Analysis has become an essential skill in today’s technology-driven environment.
Python offers a simple programming structure combined with advanced analytical capabilities. It allows users to clean, process, visualize, and interpret large datasets effectively. Whether someone is starting as a beginner or working as an experienced analyst, Python provides flexible solutions for every stage of data analysis.
The popularity of Python Data Analysis continues to grow because it supports automation, statistical analysis, visualization, and machine learning in a single ecosystem.
Why Python is Widely Used for Data Analysis
Python has become one of the most popular programming languages in the field of data analysis because of its simplicity, flexibility, and powerful analytical capabilities. Businesses, researchers, and data professionals across industries rely on Python to process data, identify trends, and generate actionable insights. Whether someone is a beginner learning analytics or an experienced professional handling large-scale projects, Python offers tools and libraries that simplify the entire analytical workflow.
One of the biggest reasons behind the popularity of Python in data analysis is its easy-to-understand syntax. Unlike many complex programming languages, Python uses a clean and readable structure that allows users to write and understand code quickly. This beginner-friendly nature reduces the learning curve and helps analysts focus more on solving problems rather than struggling with technical coding difficulties. Even individuals with limited programming experience can start performing data analysis tasks efficiently using Python.
Key advantages of Python for data analysis include:
- Easy-to-understand programming structure
- Beginner-friendly coding environment
- Efficient handling of large datasets
- Powerful data cleaning and processing capabilities
- Strong support for data visualization
- Compatibility with statistical analysis
- Automation of repetitive analytical tasks
- Scalable workflows for growing businesses
- Integration with machine learning and AI models
- Strong community support and learning resources
Because of these advantages, Python continues to dominate the field of modern analytics. Its flexibility, efficiency, and ease of use make it an ideal choice for professionals working in business intelligence, data science, financial analysis, research, and predictive analytics. As industries continue to rely on data driven decision making, Python remains one of the most valuable tools for effective and scalable data analysis.
Essential Tools Used in Python Data Analysis
Data Manipulation Tools
Data manipulation tools help organize, filter, and transform datasets into meaningful structures. These tools are commonly used for:
- Handling tables and datasets
- Managing missing values
- Sorting and filtering records
- Combining multiple datasets
- Preparing data for analysis
Data manipulation is one of the most important stages in Python Data Analysis because clean data improves overall accuracy.
Numerical Computing Tools
Numerical computing techniques help perform mathematical and statistical operations on large datasets.
These techniques support:
- Mathematical calculations
- Matrix operations
- Statistical computations
- Scientific calculations
- Performance optimization
Numerical processing is widely used in research, forecasting, and predictive analytics.
Data Visualization Techniques
Visualization transforms raw data into understandable charts and graphs. It helps analysts identify trends and patterns more easily.
Popular visualization methods include:
- Line charts
- Bar graphs
- Scatter plots
- Histograms
- Heatmaps
Visualization improves communication and simplifies complex analytical findings.
Statistical Analysis Methods
Statistical analysis is used to interpret data and identify meaningful relationships.
Common statistical methods include:
- Mean and median calculations
- Correlation analysis
- Hypothesis testing
- Probability analysis
- Regression techniques
Statistical methods strengthen the accuracy and reliability of analytical conclusions.


- Incomplete datasets
- Poor data quality
- Large-scale processing issues
- Visualization complexity
- Data security concerns
Important Python Data Analysis Techniques
Data Cleaning
Data cleaning is the process of correcting or removing inaccurate information from datasets.
Common cleaning tasks include:
- Removing duplicate entries
- Fixing formatting issues
- Handling missing values
- Correcting invalid records
- Standardizing data formats
Proper data cleaning improves the quality of analysis results.
Exploratory Data Analysis
Exploratory Data Analysis helps analysts understand patterns, relationships, and distributions before deeper analysis begins.
This process includes:
- Data summarization
- Trend analysis
- Visualization
- Correlation checking
- Pattern identification
Exploration is a critical step in professional Python Data Analysis workflows.
Data Transformation
Data transformation prepares datasets for analysis by converting them into usable formats.
Transformation techniques include:
- Data normalization
- Encoding categorical values
- Scaling numerical data
- Aggregating information
- Restructuring datasets
Transformation improves compatibility with analytical models and reporting systems.
Predictive Analysis
Predictive analysis uses historical data to estimate future outcomes.
Applications include:
- Sales forecasting
- Demand prediction
- Customer behavior analysis
- Risk assessment
- Trend forecasting
Predictive techniques are commonly used in advanced analytics and business intelligence systems.
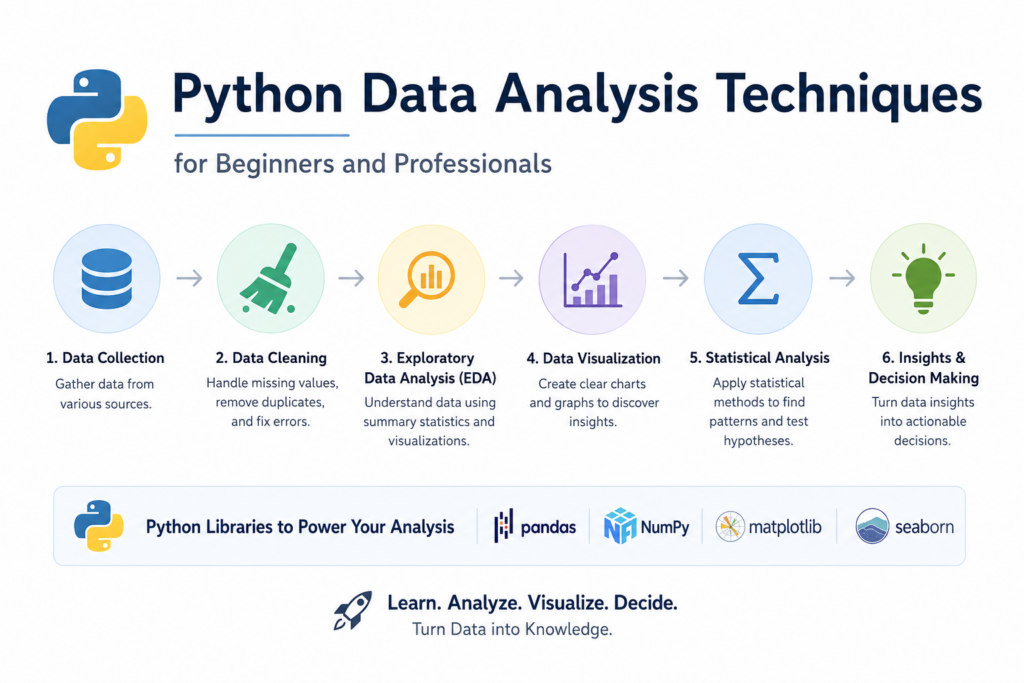
Python Data Analysis Workflow
A well structured Python Data Analysis workflow helps analysts manage data efficiently, reduce errors, and generate accurate insights. In modern analytics projects, following a systematic process is essential because it improves consistency, speeds up analysis, and supports better decision making. Python provides powerful tools and libraries that simplify every stage of the analytical process, from collecting raw data to presenting final business insights.
A complete Python Data Analysis workflow generally includes data collection, data preparation, exploration, visualization, statistical analysis, and reporting. Each step plays an important role in transforming raw information into meaningful conclusions that organizations can use for growth and strategy planning.
Step 1: Data Collection
The first stage of the Python Data Analysis workflow is data collection. Analysts gather data from multiple sources depending on business requirements and project objectives. Accurate and relevant data is the foundation of successful analysis because poor-quality data can lead to incorrect conclusions and unreliable predictions.
Python allows users to collect and import data from a wide variety of platforms and systems. This flexibility makes it highly suitable for real-world analytics projects where information often comes from different sources.
Data can be collected from:
- Databases
- CSV files
- APIs
- Cloud systems
- Excel spreadsheets
- Web applications
- Online surveys
- Business management software
- Financial systems
- Social media platforms
Python simplifies the process of importing large datasets and combining information from multiple channels into a single analytical environment.
Step 2: Data Preparation
After collecting data, the next step is data preparation. Raw data is often incomplete, inconsistent, duplicated, or poorly formatted. Before performing any analysis, the data must be cleaned and organized properly to ensure accuracy and reliability.
Data preparation is considered one of the most important stages in Python Data Analysis because high-quality input leads to better analytical results. Analysts spend significant time removing errors and transforming raw information into a usable format.
Common data preparation tasks include:
- Removing duplicate records
- Handling missing values
- Correcting formatting errors
- Standardizing data structures
- Filtering irrelevant information
- Combining multiple datasets
- Converting data types
- Detecting outliers and inconsistencies
Python provides efficient tools for cleaning and transforming datasets, making large scale data preparation faster and more manageable.
Step 3: Data Exploration
Once the data is cleaned, analysts begin exploring the dataset to identify trends, patterns, relationships, and anomalies. Data exploration helps professionals understand how the information behaves before applying advanced analytical techniques.
This stage is critical because it reveals hidden insights and helps analysts choose the right statistical or machine learning methods for further analysis. Exploratory analysis also helps businesses identify opportunities, risks, and performance indicators.
During data exploration, analysts may:
- Examine data distributions
- Identify trends and patterns
- Analyze customer behavior
- Detect correlations between variables
- Study seasonal performance changes
- Compare different categories or segments
- Identify unusual values or anomalies
Python enables fast exploratory analysis using descriptive statistics and visual summaries, allowing analysts to make informed analytical decisions.
Step 4: Data Visualization
Data visualization is an essential part of the Python Data Analysis workflow because visual representations make complex data easier to understand. Charts, graphs, and dashboards help organizations interpret analytical findings quickly and communicate insights more effectively.
Visual analytics improves decision-making by highlighting trends, comparisons, and relationships that may not be obvious in raw numerical data. Businesses often rely on visual reports to track performance and monitor key metrics.
Common visualization methods include:
- Bar charts
- Line graphs
- Pie charts
- Scatter plots
- Histograms
- Heatmaps
- Interactive dashboards
- Trend analysis reports
Python supports both basic and advanced visualization techniques, helping analysts create professional and interactive reports for presentations and business discussions.
Step 5: Statistical Analysis
After visual exploration, analysts apply statistical methods to validate findings and draw meaningful conclusions. Statistical analysis helps determine whether patterns observed in the data are significant and reliable.
This stage is extremely important in business intelligence, scientific research, marketing analytics, finance, and predictive modeling. Python allows analysts to perform both simple and advanced statistical calculations efficiently.
Statistical analysis may include:
- Hypothesis testing
- Regression analysis
- Correlation analysis
- Probability calculations
- Predictive analysis
- Trend forecasting
- Variance analysis
- Sampling techniques
Using Python for statistical analysis improves analytical precision and supports evidence-based decision-making across industries.
Step 6: Reporting and Insights
The final stage of the Python Data Analysis workflow is reporting and insight generation. After completing the analysis, analysts prepare reports that summarize findings, trends, recommendations, and business conclusions.
Clear reporting is essential because analytical insights must be understandable to managers, stakeholders, and decision-makers. Well-structured reports help organizations take strategic actions based on data-driven evidence.
Final reports may include:
- Performance summaries
- Business recommendations
- KPI dashboards
- Predictive insights
- Growth opportunities
- Risk assessments
- Customer behavior analysis
- Market trend reports
Python helps automate reporting processes and generate professional analytical outputs that improve communication and strategic planning.
- Clean data before analysis
- Validate dataset accuracy
- Use visualization for better understanding
- Organize workflows systematically
- Optimize code performance
- Document analytical processes clearly
Python Data Analysis for Beginners
Beginners should focus on understanding fundamental concepts before moving to advanced analytics.
Recommended starting topics include:
- Python basics
- Variables and data types
- Loops and functions
- Working with datasets
- Basic visualization
- Data filtering techniques
Small practice projects help improve learning speed and analytical confidence.
Examples of beginner projects:
- Expense tracking analysis
- Student performance reports
- Weather dataset analysis
- Sales trend visualization
- Social media data analysis
Python Data Analysis for Professionals
Professional analysts often work with larger datasets and more complex workflows.
Advanced areas include:
- Automation pipelines
- Real-time analytics
- Statistical modeling
- Predictive systems
- Machine learning integration
- Advanced visualization dashboards
Professional-level analysis focuses on efficiency, scalability, and accuracy.
Conclusion
Python Data Analysis has become an essential skill for both beginners and professionals in the modern digital world. It provides efficient methods for data cleaning, visualization, statistical analysis, and predictive modeling. With its flexibility, scalability, and simplicity, Python supports a wide range of analytical applications across industries.
Learning Python data analysis techniques helps individuals improve decision making, automate workflows, and build valuable analytical expertise for future career growth.
Frequently Asked Questions
Answer:
Python data analysis techniques include data cleaning, data visualization, statistical analysis, data transformation, and predictive modeling. These techniques help analysts organize raw information and extract meaningful insights. Beginners often start with libraries like Pandas and NumPy, while professionals use advanced machine learning and automation methods for large-scale analysis.
Answer:
Python is popular for data analysis because it is simple, flexible, and supported by powerful libraries. Tools such as Pandas, Matplotlib, and Scikit-learn make data processing faster and more accurate. Python Data Analysis is also useful for handling large datasets, creating reports, and building predictive analytics models across industries.
Answer:
The best Python libraries for data analysis include Pandas for data manipulation, NumPy for numerical calculations, Matplotlib and Seaborn for visualization, and Scikit-learn for machine learning. These libraries simplify complex analytical tasks and improve workflow efficiency for both beginners and professionals working with data-driven projects.
Answer:
Beginners can start learning Python Data Analysis by understanding basic Python programming and practicing with small datasets. Learning concepts such as data cleaning, filtering, grouping, and visualization is essential. Online tutorials, real-world projects, and practice with libraries like Pandas help build strong analytical skills over time.
Answer:
Python Data Analysis helps professionals improve decision-making through accurate insights and automated workflows. It supports advanced analytics, machine learning, and business intelligence applications. Professionals use Python to analyze customer behavior, monitor performance metrics, and generate visual reports that support strategic business growth.

