
Confidence Intervals
Confidence Intervals in Data Analytics
Confidence intervals are one of the most powerful tools in Data Analytics and Statistics. They help analysts move beyond single number estimates and understand the range within which the true value is likely to fall.
In this blog, you’ll learn what confidence intervals are, how they work, and why they are essential for making reliable, data driven decisions.
- Confidence intervals estimate a range of values for an unknown population parameter.
- They are a key concept in Data Analytics and Statistics.
- A confidence level (90%, 95%, 99%) shows how reliable the estimate is.
- Larger sample sizes produce more precise intervals.

What Are Confidence Intervals in Data Analytics?
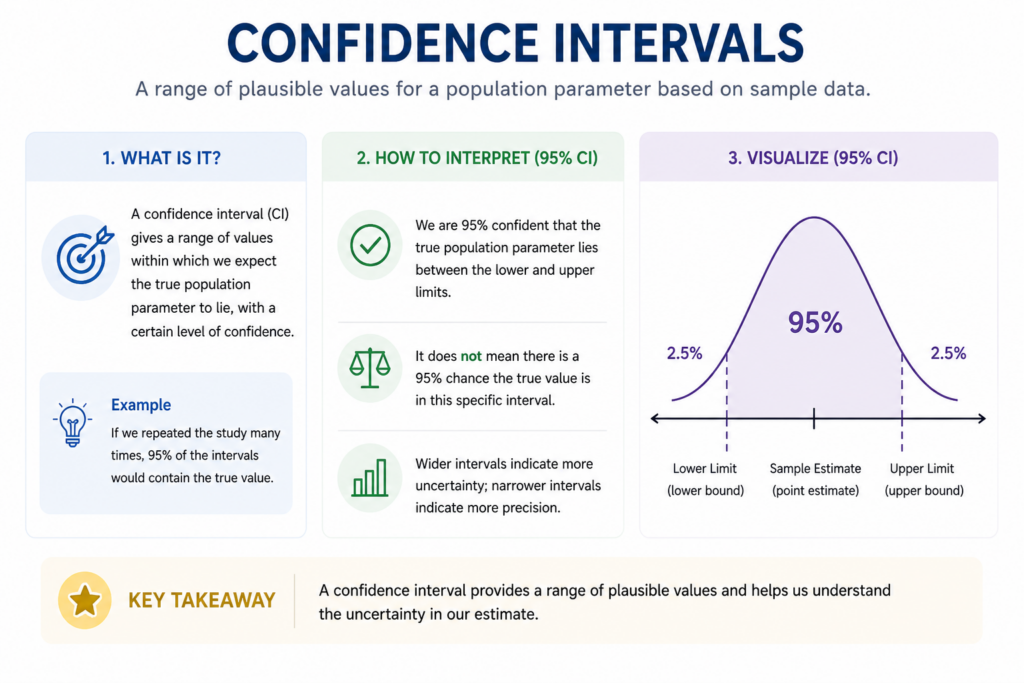
In data analytics, a confidence interval (CI) is a statistical range used to estimate an unknown population parameter such as average revenue, conversion rate, or customer retention based on sample data. Instead of relying on a single number, analysts use confidence intervals to present a range of likely values, which makes insights more realistic and dependable.
When working with real world data, uncertainty is unavoidable due to sampling limitations, data variability, and measurement imperfections. Confidence intervals help quantify this uncertainty, allowing analysts to communicate not just what the estimate is, but how reliable it is.
For example, in a business analytics scenario, instead of saying:
- “The average monthly sales is ₹10,000”
a data analyst would report:
- “The average monthly sales is between ₹9,200 and ₹10,800 with 95% confidence.”
This means that the analyst is reasonably confident that the true average sales lies within this range. The 95% confidence level indicates that if the same analysis were repeated multiple times using different samples, most of the calculated intervals would capture the true value.
In data analytics, confidence intervals are especially useful for:
- Evaluating business performance metrics
- Supporting data-driven decision-making
- Validating results in A/B testing and experiments
- Understanding the uncertainty in predictive models
Overall, confidence intervals transform raw data into actionable insights with context, helping organizations make smarter and more informed decisions.
Confidence Interval Formula
\bar{x} \pm Z \cdot \frac{\sigma}{\sqrt{n}}
In data analytics, the confidence interval formula is used to estimate the range within which a population parameter (like the true mean) is likely to fall based on sample data. This formula helps analysts quantify uncertainty and make more reliable predictions from limited datasets.
The formula consists of two main parts:
- The sample mean (x̄), which represents the central estimate
- The margin of error, which adjusts the estimate based on variability and sample size
Explanation of Components:
- x̄ (x-bar): The average value calculated from your sample data
- Z (Z-score): A value derived from the confidence level (e.g., 1.96 for 95% confidence)
- σ (sigma): The standard deviation, representing how spread out the data is
- n: The total number of observations in the sample
In practical data analytics scenarios, this formula allows you to move beyond single-value estimates and instead provide a range that reflects data variability and confidence level.
For example, when analyzing customer spending or website traffic, using a confidence interval helps businesses understand not just the expected value, but also the possible variation around it, leading to more informed and data-driven decisions.
- Misinterpreting confidence level
- Using small sample sizes
- Ignoring distribution assumptions
- Confusing margin of error with standard deviation


Key Components of Confidence Intervals
Understanding confidence intervals becomes much easier when you break them into their core components. Each element directly affects how reliable and precise your analysis is.
1. Confidence Level
The confidence level represents how certain you are that the interval contains the true population value. It is usually expressed as a percentage.
- 90% Confidence Level → Narrower interval, but lower certainty
- 95% Confidence Level → Most commonly used standard in data analytics
- 99% Confidence Level → Wider interval, but higher certainty
In practical terms, a higher confidence level increases reliability but also makes the interval broader.
2. Margin of Error
The margin of error determines the width of the confidence interval. It shows how much the estimate can vary from the true population value.
- Smaller Margin of Error → More precise and tighter interval
- Larger Margin of Error → Less precision and wider interval
In data analytics, reducing the margin of error is key for generating accurate and actionable insights.
3. Sample Size
The sample size (n) plays a critical role in shaping the confidence interval. Larger datasets typically produce more stable and reliable results.
- Larger Sample Size → Narrower intervals and higher accuracy
- Smaller Sample Size → Wider intervals and more uncertainty
This is why data analysts often aim to collect sufficient data before making decisions or predictions.
Why These Components Matter
In data analytics, these three components work together to balance precision, reliability, and practicality. Adjusting any one of them impacts the final confidence interval, which ultimately influences how confidently decisions can be made from the data.
Types of Confidence Intervals
In data analytics, different types of confidence intervals are used depending on the nature of the data and what you are trying to estimate. Choosing the right type ensures your analysis is both accurate and meaningful.
1. Mean Confidence Interval
A mean confidence interval is used when you want to estimate the average value of a population based on sample data.
- Common use cases: average sales, mean customer spending, average session time
- Works best when data is continuous and roughly normally distributed
This is one of the most widely used confidence intervals in business analytics and reporting.
2. Proportion Confidence Interval
A proportion confidence interval is used to estimate percentages or probabilities within a population.
- Common use cases: conversion rates, click through rates, customer retention percentage
- Typically applied to binary outcomes (e.g., success/failure, yes/no)
It helps analysts understand how a sample proportion reflects the overall population.
3. T-Distribution Confidence Interval
A t-distribution confidence interval is used when certain conditions make the standard (Z-based) approach less reliable.
It is preferred when:
- Sample size is small (typically less than 30)
- Population standard deviation (σ) is unknown
In such cases, the t-distribution accounts for additional uncertainty, resulting in slightly wider but more accurate intervals.
- Business analytics (sales forecasting)
- Healthcare (clinical trials)
- Marketing (A/B testing)
- Finance (risk estimation)
- Machine learning (model evaluation)
Confidence Intervals vs Hypothesis Testing
| Aspect | Confidence Interval | Hypothesis Testing |
|---|---|---|
| Output | Range of values | Accept/Reject |
| Insight | Detailed | Binary |
| Usage | Estimation | Testing |
Best Practices
- Use larger datasets
- Choose correct confidence level
- Validate assumptions
- Always report margin of error
- Combine with other statistical methods
Conclusion
Confidence intervals are a fundamental concept in data analytics, helping analysts move beyond single point estimates to a more reliable and realistic understanding of data. Instead of presenting results as fixed values, confidence intervals provide a range that reflects uncertainty, making insights more transparent and trustworthy.
In today’s data driven world, businesses rely heavily on accurate insights for decision making. Confidence intervals play a crucial role by showing how precise an estimate is and how much variation can be expected. This is especially important in areas like A/B testing, forecasting, performance analysis, and predictive modeling, where decisions directly impact growth and strategy.
Frequently Asked Questions
Answer:
A confidence interval is a range of values used to estimate an unknown population parameter based on sample data. It shows where the true value is likely to fall. Instead of a single estimate, it provides a more realistic and reliable insight. This helps analysts make better data-driven decisions.
Answer:
A 95% confidence interval means that if the same sampling process is repeated many times, about 95% of the calculated intervals will contain the true population value. It does not mean there is a 95% chance the value is inside one specific interval. It reflects the reliability of the method, not a single result.
Answer:
Confidence intervals are important because they measure the uncertainty in data analysis. They help analysts understand how accurate their estimates are. This leads to better decision-making in areas like business forecasting and experiments. They also improve the credibility of insights.
Answer:
Sample size has a direct impact on the width of a confidence interval. Larger sample sizes produce narrower intervals, which means more precise estimates. Smaller samples lead to wider intervals and more uncertainty. That’s why collecting enough data is crucial in analytics.
Answer:
Confidence intervals provide a range of possible values for a parameter, while hypothesis testing gives a yes/no decision (accept or reject). Confidence intervals offer more detailed insights about data variability. Hypothesis testing focuses on validating assumptions. Both are important but serve different purposes.
Answer:
You should use a t-distribution when the sample size is small or when the population standard deviation is unknown. The t-distribution accounts for extra uncertainty in such cases. It produces wider intervals compared to the z-score method. This ensures more accurate and reliable results in limited data scenarios.

