
Table Calculations and Level of Detail Calculations
Table Calculations and Level of Detail Calculations in Tableau
LOD Expressions Explained
Table Calculations and Level of Detail Calculations in Tableau are advanced analytical features that allow users to perform powerful computations directly within visualizations. While basic aggregations like SUM or AVG are useful, real world data analysis often requires deeper insights, such as running totals, percentage differences, or calculations at different levels of data granularity.
This is where LOD Expressions in Tableau and table calculations come into play. These techniques help analysts control how and where calculations are performed, enabling more flexible and accurate data analysis.

What are Table Calculations in Tableau?
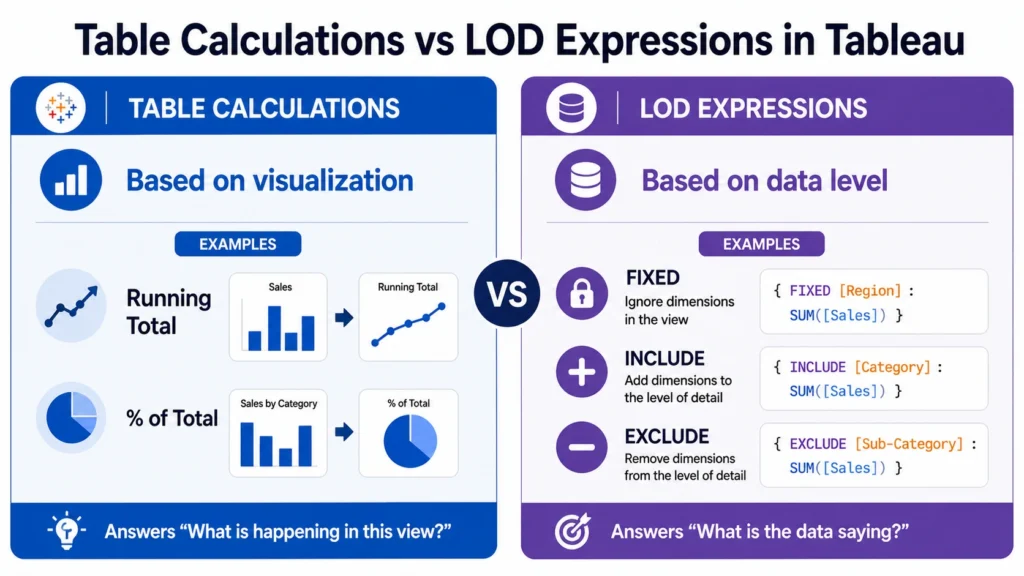
Table calculations are computations performed on the data already present in a visualization. In simple terms, they work on displayed data, not the underlying dataset.
Characteristics of Table Calculations:
- Performed after data is aggregated
- Depend on the layout of the visualization
- Calculated across rows, columns, or partitions
Types of Table Calculations
1. Running Total
Calculates cumulative values over time.
Example: Monthly sales cumulative total
2. Difference Calculation
Shows difference between values.
Example: Sales difference between months
3. Percentage of Total
Shows contribution of each value.
Example: Product sales percentage
4. Moving Average
Calculates average over a period.
Example: 3 month rolling average
5. Rank Calculation
Ranks values based on performance.
Example: Top performing products
How Table Calculations Work?
Table calculations operate based on:
- Addressing → Direction of calculation
- Partitioning → How data is grouped
These concepts control how results are computed.
Limitations of Table Calculations:
- Dependent on visualization structure
- Limited control over raw data
- Can be confusing for beginners

What are Level of Detail Calculations in Tableau?
Level of Detail Expressions in Tableau (LOD Expressions) allow users to perform calculations independent of the visualization level. In simple terms, LOD expressions work on underlying data, not just displayed data.
Why Use LOD Expressions in Tableau:
Using LOD Expressions in Tableau helps:
- Control data granularity
- Perform calculations at different levels
- Improve accuracy
- Handle complex analytical scenarios
Types of Level of Detail Expressions in Tableau
1. FIXED LOD Expression
Calculates values at a specified level, regardless of visualization.
Example: Calculates total sales per region, ignoring other dimensions.
{ FIXED [Region] : SUM([Sales]) } 2. INCLUDE LOD Expression
Adds additional dimensions to the calculation.
Example:
{ INCLUDE [Product] : SUM([Sales]) } 3. EXCLUDE LOD Expression
Removes specific dimensions from calculation.
Example:
{ EXCLUDE [Category] : SUM([Sales]) } 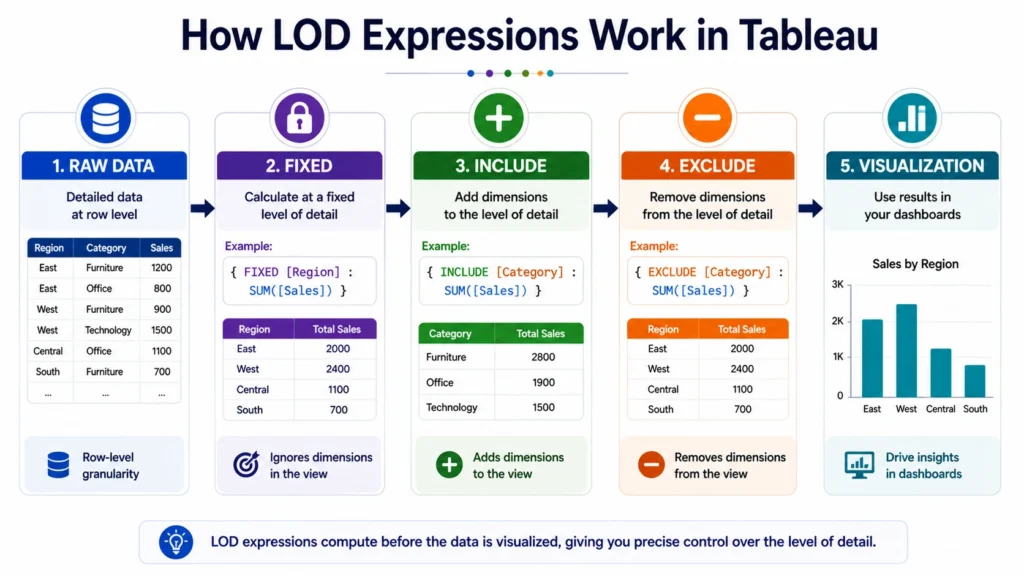
LOD Expressions vs Table Calculations
Understanding the difference is critical:
| Feature | Table Calculations | LOD Expressions in Tableau |
|---|---|---|
| Data Level | Visualization level | Data source level |
| Dependency | Depends on layout | Independent of layout |
| Flexibility | Limited | High |
| Use Case | Quick calculations | Advanced analytics |
When to Use Table Calculations vs LOD Expressions
Use Table Calculations:
- For quick visual calculations
- ‘For trends and comparisons
Use LOD Expressions:
- For precise data control
- For complex business logic
- For independent calculations
Real World Use cases of Table calculation and LOD Expressions
- KPI Dashboards: Use LOD to calculate fixed metrics
- Performance Analysis: Use table calculations for trends
- Customer Segmentation: Use LOD expressions for grouping
- Financial Analysis: Use both techniques together
Best Practices for Table calculation and LOD Expressions
- Use LOD for accuracy
- Use table calculations for quick insights
- Avoid mixing unnecessarily
- Keep calculations readable
- Test results carefully
Common Mistakes to Avoid….
- Confusing LOD with table calculations
- Overusing complex formulas
- Ignoring data granularity
- Not understanding aggregation
Conclusion….
Understanding Table Calculations and Level of Detail Calculations in Tableau is essential for performing advanced data analysis.
While table calculations provide quick insights based on visual data, LOD Expressions in Tableau offer deeper control over data granularity and accuracy. By mastering both techniques, analysts can build more powerful, flexible, and insightful dashboards that support better decision-making in real-world scenarios.

Frequently Asked Questions
Answer:
Table calculations in Tableau are computations performed on data already displayed in the visualization.
Answer:
LOD Expressions in Tableau are used to calculate values at different levels of detail independent of the visualization.
Answer:
Table calculations depend on visualization layout, while LOD expressions work at the data level.
Answer:
Use them when you need precise control over data aggregation.
Answer:
They are types of Level of Detail Expressions used to control data granularity.

