
Skewness and Kurtosis
Understanding Skewness and Kurtosis in Statistics for Data Analytics
In the field of data analytics, understanding the shape and distribution of data is crucial. Two key concepts that help us interpret the distribution of data are skewness and kurtosis. These concepts are part of descriptive statistics and give insights into the symmetry and the “peakedness” of the data distribution.
This article will provide a clear and simple explanation of skewness and kurtosis. We’ll explore what they mean, why they matter, how to calculate them, and how to interpret them. We’ll also look at real-life examples and how to use these concepts in Excel and Python.

What is Skewness ?
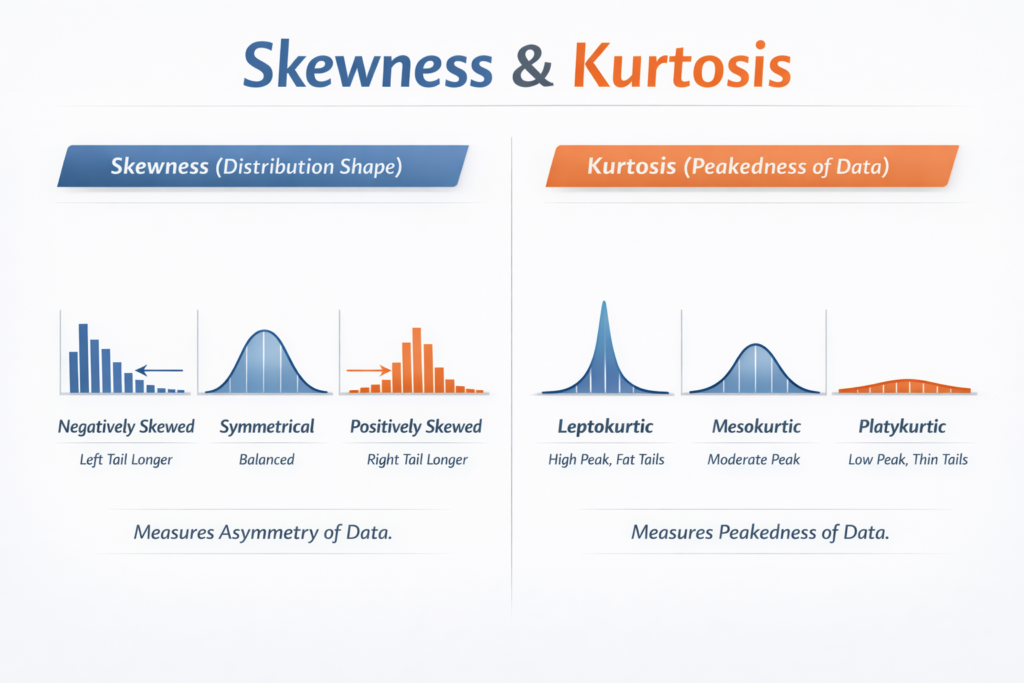
Skewness is a measure of the asymmetry of the probability distribution of a real-valued random variable. In simpler terms, it tells us whether the data is symmetrical or leans more to one side.
Types of Skewness:
Symmetrical Distribution: Data is evenly spread around the mean.
Skewness = 0
Example: Heights of adults
Positive Skew (Right Skew):
The right tail (higher values) is longer.
Mean > Median > Mode
Skewness > 0
Example: Income distribution (a few people earn much more)
Negative Skew (Left Skew):
The left tail (lower values) is longer.
Mean < Median < Mode
Skewness < 0
Example: Age at retirement (most people retire at a certain age, few retire early)
Why Skewness Matters:
Helps in understanding the direction of outliers.
Affects statistical tests like t-tests and regression analysis.
Influences data transformation decisions (e.g., using log transformation).
What is Kurtosis ?
Kurtosis is a statistical measure that describes the shape of a distribution’s tails in relation to its overall shape. It tells us about the “peakedness” or flatness of a distribution.
Types of Kurtosis:
- Mesokurtic (Normal Distribution):
- Kurtosis = 3 (Excess Kurtosis = 0)
- Moderate peak and tails
- Leptokurtic (Heavy Tails):
- Kurtosis > 3 (Excess Kurtosis > 0)
- Sharp peak, heavy tails
- Example: Stock market returns
- Platykurtic (Light Tails):
- Kurtosis < 3 (Excess Kurtosis < 0)
- Flat peak, light tails
- Example: Uniform distribution
Why Kurtosis Matters:
- Indicates the likelihood of extreme values (outliers).
- Helps assess the risk in finance and quality control.
- Impacts the reliability of statistical models.
- Skewness measures the asymmetry of the data distribution.
➤ It helps analysts understand if the data leans left, right, or is symmetric.
➤ This is useful when checking for bias or non-normality in data before modeling. - Kurtosis measures the tailedness or peakness of the distribution.
➤ It shows whether data has extreme values (outliers) more or less than a normal distribution.
➤ This is important for assessing risk, volatility, and anomaly detection.


How to Calculate Skewness and Kurtosis
Both skewness and kurtosis can be calculated using formulas, but software tools like Excel, Python, and R make it easier.
1. Skewness Formula
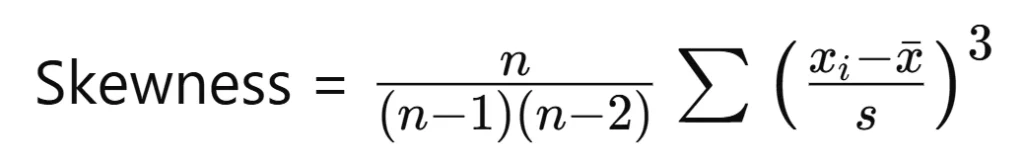
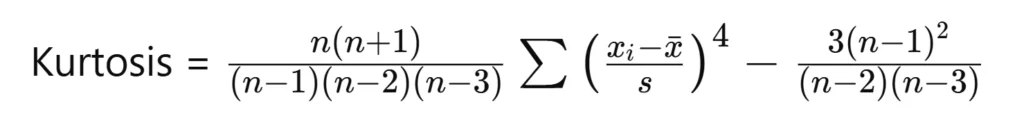
- xi = value
- x̄ = mean
- s = standard deviation
- n = number of values
2. Kurtosis Formula
Interpreting Skewness and Kurtosis
| Measure | Value Range | Interpretation |
Skewness | = 0 | Perfect symmetry |
| > 0 | Right skewed distribution | |
| < 0 | Left skewed distribution | |
Kurtosis | = 3 | Normal peak (Mesokurtic) |
| > 3 | High peak, heavy tails (Leptokurtic) | |
| < 3 | Low peak, light tails (Platykurtic) |
Practical Examples of Skewness and Kurtosis
Example 1: Income Distribution (Right-Skewed)
Most people earn average salaries, but a few earn very high.
Skewness > 0
Kurtosis > 3 (because of outliers)
Example 2: Test Scores (Left-Skewed)
Most students score high, few score low.
Skewness < 0
Kurtosis around 3 if data is normally spread
Example 3: Product Reviews (Symmetrical)
Ratings on a product mostly range evenly from 1 to 5
Skewness = 0
Kurtosis = 3
Implementing Skewness and Kurtosis in Excel and Python
Skewness and Kurtosis in Excel
Step by Step Process:
Input data in a column (e.g., A1:A10)
Use formulas:
Skewness:
=SKEW(A1:A10)Kurtosis:
=KURT(A1:A10)
Example:
Data: 10, 12, 15, 18, 20, 21, 23, 25, 29, 100 (includes an outlier)
Skewness > 0
Kurtosis > 3
Skewness and Kurtosis in Python
import pandas as pd
import scipy.stats as stats

# Sample Data
data = [10, 12, 15, 18, 20, 21, 23, 25, 29, 100]

# Skewness
print("Skewness:", stats.skew(data))

# Kurtosis
print("Kurtosis:", stats.kurtosis(data))  # Excess Kurtosis (normal = 0)
Python gives both skewness and kurtosis with just one line each.
If excess kurtosis = 0, the data is mesokurtic.
Limitations of Skewness and Kurtosis
Sensitive to outliers
Not always intuitive
Should not be used alone; always consider with histograms and boxplots
Applications in Data Analytics
Outlier Detection
High kurtosis may indicate outliers.
Data Transformation
Skewed data may need transformation (e.g., log, sqrt) before applying machine learning models.
Financial Analytics
Skewness helps understand return distribution.
Kurtosis helps in risk estimation.
Machine Learning
Many models assume normal distribution. Skewness and kurtosis help validate this assumption.
Overview of Skewness and Kurtosis
Skewness: Measures asymmetry
0: Right skewed
< 0: Left skewed
= 0: Symmetrical
Kurtosis: Measures tail weight (peakedness)
3: Heavy tails (leptokurtic)
< 3: Light tails (platykurtic)
= 3: Normal tails (mesokurtic)
Use Excel or Python to easily calculate both, and always combine them with visualizations for a complete picture.
Conclusion
Skewness and kurtosis are essential tools in understanding the distribution of your data. Skewness tells us about the symmetry, while kurtosis tells us about the peaks and tails. Knowing these can help you make better decisions in data preprocessing, model selection, and interpretation.
Whether you’re working in finance, healthcare, retail, or any other domain, understanding these concepts will enhance your ability to analyze and interpret data accurately.
Frequently Asked Questions
Answer:
Skewness measures the asymmetry of a data distribution around its mean. A positive skew means a longer right tail, while a negative skew indicates a longer left tail.
Answer:
Kurtosis measures the “tailedness” or peak shape of a distribution. High kurtosis shows heavy tails and sharp peaks, while low kurtosis indicates lighter tails and flatter distributions.
Answer:
Skewness focuses on the direction of data asymmetry, whereas kurtosis evaluates how extreme the data values are. Together, they describe the overall shape of a dataset.
Answer:
They help identify whether data follows a normal distribution or not. This is crucial for choosing the right statistical tests and making accurate predictions.
Answer:
Zero skewness indicates a perfectly symmetrical distribution like normal distribution. A kurtosis value close to normal (mesokurtic) suggests moderate tails and peak.
Answer:
They are widely used in finance, machine learning, and quality control to detect outliers and understand data behavior. This helps in risk analysis and better decision-making.

