
Measures of Variability
Understanding Measures of Variability
Measures of Variability are crucial in any data analysis, as they help us understand the spread or dispersion within a dataset. While measures of central tendency like the mean or median tell us about the center of the data, variability shows how much the data points differ from that center.
Understanding how spread out the data is can be just as important as understanding the average. These tools offer insight into the consistency and distribution of data, helping analysts make more accurate and reliable conclusions.

What Are Measures of Variability?
- In statistics, understanding the spread or dispersion of data is just as important as understanding the average. This is where Measures of Variability come into play. They help describe how much the data points in a dataset differ from one another or from the average.
- While measures of central tendency like mean, median, and mode give a sense of the “typical” value, they don’t provide any information about how spread out the values are.
- Variability fill in that gap by showing whether the data is tightly clustered or widely spread out.
- Understanding variability allows researchers, analysts, and decision-makers to get a complete picture of the dataset. For example, two datasets might have the same average, but one could have data points spread far apart, while the other could have them closely packed together.
- Knowing the variability helps in making better predictions, comparisons, and conclusions.
Key Measures of Variability:
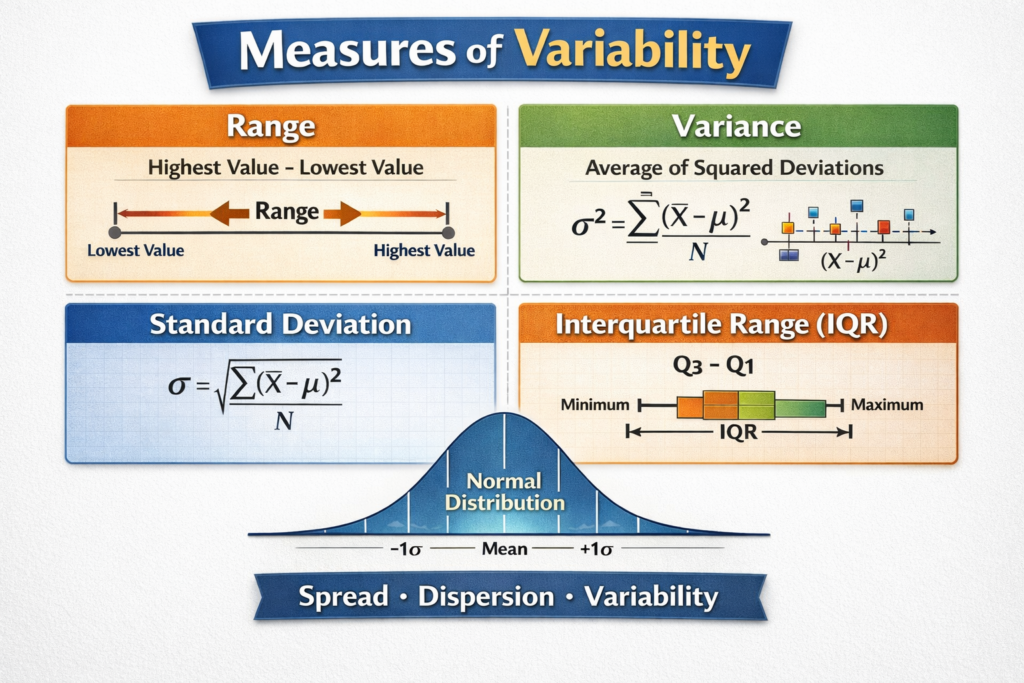
- Range: The simplest measure of variability. It is the difference between the highest and lowest values in a dataset. While easy to calculate, it can be heavily influenced by outliers.
- Interquartile Range (IQR): This measures the range within which the central 50% of the data lies. It is calculated by subtracting the first quartile (Q1) from the third quartile (Q3). The IQR is more resistant to outliers than the simple range.
- Variance: This indicates how much the data points differ from the mean. It is calculated by taking the average of the squared differences from the mean. A higher variance means more spread in the data.
- Standard Deviation: The most commonly used measure of variability. It is the square root of the variance and gives a measure of spread in the same units as the original data. It tells us how much the individual data points typically differ from the mean.
These tools allow statisticians and researchers to understand the consistency and reliability of data. Using Measures of Variability, one can evaluate the quality and comparability of different datasets more effectively. Whether you are analyzing exam scores, financial data, or customer satisfaction ratings, these measures are essential to draw accurate conclusions and make informed decisions.
- Generate ultra realistic outputs that mimic real world data.
- Require minimal supervision once training begins.
- Excellent for complex unsupervised tasks.
- Great for privacy use synthetic data instead of sensitive real data.

Types of Variability in Statistics
In the study of statistics, understanding the spread of data is crucial for gaining accurate insights. This spread, or dispersion, is measured using various statistical tools known as Measures of Variability. These tools go beyond just understanding the average values and help us comprehend how much the data points differ from each other or from a central value like the mean. Three of the most commonly used types of variability in statistics are the range, variance, and standard deviation. Each offers a unique way to evaluate how data behaves across a dataset.
Here’s a deeper look at these key types of variability:
1. Range
- Definition: The range is the most basic form of variability. It represents the difference between the highest and the lowest value in a dataset.
- Formula: Range=Maximum Value−Minimum Value
- Explanation: If a dataset has values ranging from 15 to 95, the range would be 80. This tells us that there is an 80-unit spread from the smallest to the largest value.
- Pros and Cons: The range is very easy to calculate and provides a quick snapshot of how spread out the data is. However, it is extremely sensitive to outliers. A single unusually high or low value can drastically affect the range, making it less reliable for datasets with extreme values.
2. Variance
- Definition: Variance measures the average squared deviation of each data point from the mean of the dataset. It shows how much, on average, each value differs from the mean.
- Formula: Variance= n∑(x− x) 2
- where 𝑥 is each data point, x is the mean, and n is the number of data points.
- Explanation: A higher variance means that the data points are more spread out from the mean, while a lower variance indicates that they are closer to the mean.
- Usefulness: Variance is particularly useful in statistical modeling and probability theory, where understanding how data fluctuates from the average is essential.
- Drawback: One limitation of variance is that it is expressed in squared units (e.g., squared meters if the original data is in meters), which can make interpretation less intuitive.
3. Standard Deviation
- Definition: Standard deviation is the square root of the variance. It represents the average amount by which each data point differs from the mean, but expressed in the same units as the data.
- Formula: Standard Deviation = \sqrt(Variance)
- Explanation: If a dataset has a standard deviation of 5, that means on average, each value in the dataset differs from the mean by about 5 units.
- Benefits: Standard deviation is widely used because it’s easy to interpret and compare. It allows for better understanding and communication of how much variability exists within a dataset. In practical applications like finance, healthcare, and education, standard deviation is commonly used to assess consistency or risk.
Why These Measures Matter
Using Variability like range, variance, and standard deviation helps provide a fuller understanding of a dataset. While averages can be misleading if used alone, variability measures highlight how consistent or erratic the data truly is. They play a critical role in quality control, risk management, hypothesis testing, and virtually every area where data driven decisions are made.
Understanding these concepts allows researchers and analysts to assess the reliability of the data, compare different datasets, and make more informed conclusions based on the spread of the information, not just the center.

How to Calculate Statistical Spread
Understanding how data is spread out within a dataset is an essential aspect of statistics. It helps you analyze the consistency, reliability, and predictability of data in various fields such as science, education, business, and healthcare. Below is a simplified step by step guide to calculating common tools that measure the spread of data, presented entirely in theory.
1. Determining the Range
- The range is the most basic method of identifying how spread out a dataset is.
- It is calculated by identifying the largest and smallest values within a dataset.
- The difference between the maximum and minimum values provides a quick understanding of how wide the data values are spread.
- This method is simple and fast, but it is highly sensitive to extreme values or outliers, which can distort the actual spread of most of the data.
2. Finding the Mean
- The mean is the central point or the average of the dataset.
- To find the mean, you need to combine all the values and then divide by the total number of data points.
- The mean acts as a reference point for understanding how each data value compares to the center of the dataset.
- This step is important because future calculations depend on knowing how far individual values are from this central point.
3. Understanding the Concept of Variance
- Variance provides insight into the average amount of spread in a dataset.
- To calculate it, each value’s distance from the mean is considered.
- These distances are treated in a way that avoids negative differences canceling out positive ones.
- The goal of this process is to find a single value that represents the overall spread of the dataset in relation to the mean.
- A larger value suggests more inconsistency or fluctuation among the data, while a smaller value suggests that data points are more consistent and close to the mean.
4. Identifying the Standard Deviation
- Standard deviation is a more refined and commonly used indicator of spread.
- It builds on the concept of variance but presents the result in the same unit as the original data, making it more interpretable.
- It tells you how much the data points typically deviate from the mean.
- A smaller standard deviation indicates that data points are closely packed around the average.
- A larger standard deviation shows that the data is more spread out and less predictable.
5. The Importance of Each Step
- Each of the above steps adds a new layer of understanding to the overall structure and behavior of your dataset.
- Starting with the range gives a general idea of the spread.
- Calculating the mean provides a reference point.
- Evaluating the variance offers insight into how consistent or inconsistent the values are.
- Finally, the standard deviation translates this information into a practical value that is easier to interpret and apply.
6. Applications of Data Spread in Real Life
- In education, these steps help assess whether student scores are consistent or widely varied.
- In finance, understanding data spread is crucial for evaluating risk and market behavior.
- In manufacturing, it can indicate whether production is consistent or if there are flaws in quality control.
- In health studies, it helps researchers determine the reliability of clinical test results across different patients.
By following this structured approach, anyone can begin to analyze datasets more effectively. These tools are essential for making sense of raw data and transforming it into meaningful insights that inform decisions and strategies in both academic and professional settings.
- Helps assess risk by understanding fluctuations in sales, revenue, or customer behavior.
- Aids in identifying inconsistent performance across departments or time periods.
- Improves forecasting accuracy by analyzing historical data spread.
- Supports smarter inventory and supply chain planning by revealing demand variability.
- Enhances strategic planning by highlighting data patterns beyond the average.
Why Understanding Data Spread Matters in Data Analysis
- In the world of data analysis, it’s not enough to simply look at averages. While the average or mean can give you a general sense of the data, it doesn’t tell the whole story.
- Two datasets can have the exact same average and yet behave in completely different ways. That’s where analyzing the spread of the data becomes essential.
- Looking at how data is distributed helps reveal the underlying patterns and consistency. It tells you whether the values are tightly grouped around the average or scattered widely across a range.
- Without this context, you risk drawing incomplete or even misleading conclusions from your analysis.
- For example, when evaluating student performance, knowing that the class average is 75% doesn’t indicate whether most students scored close to that mark or if there was a wide gap between high and low performers.
- Similarly, in finance, an investment option might have an average return that looks attractive, but if its returns fluctuate wildly, it could represent a much riskier choice than it first appears.
- Understanding how spread out the data is also plays a vital role in comparing multiple datasets. If two sets of values have the same average but one has much more fluctuation, that difference can be critical depending on the context, especially in scientific research, quality control, economics, or public health studies.
- Ultimately, analyzing data spread helps you make more informed decisions. It allows you to identify trends, detect inconsistencies, and assess reliability.
- By looking beyond just the center and considering how the data behaves as a whole, you gain a more accurate and complete understanding of what the numbers are really telling you.
Conclusion….
Mastering Measures of Variability is essential for accurate, insightful data interpretation. They reveal the full story behind the numbers and allow for more nuanced analysis. By combining them with measures of central tendency, you can make better, more informed decisions with your data.
Frequently Asked Questions
Answer:
Measures of variability describe how spread out the data points are in a dataset. They go beyond averages to show the distribution and consistency of values. This helps in understanding whether data is tightly grouped or widely scattered. Common examples include range, variance, and standard deviation.
Answer:
They help analysts understand the reliability and stability of data. Without variability, averages alone can be misleading in decision-making. It also helps in comparing datasets and identifying patterns or anomalies. This is crucial in fields like finance, research, and business analytics.
Answer:
The main types include range, variance, standard deviation, and interquartile range. Each measure provides a different perspective on data spread and dispersion. For example, range shows the difference between extremes, while standard deviation shows average deviation. These tools are widely used in statistical analysis.
Answer:
Standard deviation measures how much individual data points differ from the mean. A low value indicates consistency, while a high value shows more variation. It is commonly used in finance to measure risk and in quality control processes. Businesses use it to make informed and data-driven decisions.
Answer:
A data analyst course is a structured program that teaches how to collect, process, and analyze data. It usually covers tools like spreadsheets, programming, and visualization techniques. The goal is to build practical skills through real-world examples. It prepares learners for entry-level data roles.
Answer:
You can learn data cleaning, visualization, and basic statistical analysis. It also includes working with databases and understanding data trends. Many courses focus on hands-on projects to improve practical knowledge. These skills are essential for solving real-world problems using data.
Answer:
Yes, most courses are designed for beginners with little or no prior experience. They start with basic concepts and gradually move to advanced topics. Practical exercises help in better understanding the concepts. This makes it easier for anyone to start a career in data analytics.
Answer:
A data analytics certification is a credential that proves your ability to analyze and interpret data. It shows that you have learned important tools and techniques. Certifications help validate your skills in a structured way. They are useful for building credibility in the job market.
Answer:
The most valuable certifications are those that focus on practical skills and real-world projects. They should cover tools, data handling, and visualization techniques. Industry-recognized programs often provide better career opportunities. Choosing the right one depends on your goals and skill level.
Answer:
Yes, it can improve your chances of getting hired in data-related roles. Certifications highlight your knowledge and commitment to learning. When combined with projects and practical experience, they make your profile stronger. This helps you stand out in a competitive job market.

