
One Tailed and Two Tailed Test
Understanding One Tailed and Two Tailed Test
One Tailed and Two Tailed Test in Statistics are the backbone of data analytics, helping us make informed decisions using data. One of the foundational concepts in inferential statistics is hypothesis testing which includes One Tailed and Two Tailed Test.
Within this category, we often come across the terms “one tailed” and “two tailed” tests. Although these may sound technical, the concept is quite simple when explained in everyday language.
In this article, we’ll explore what one tailed and two tailed tests are, when to use them, and how they differ. We’ll also walk through some real world examples for your understanding.

What is Hypothesis Testing ?
Before diving into one and two tailed tests, let’s quickly recap hypothesis testing.
Hypothesis testing is a statistical method that allows us to test assumptions (or hypotheses) about a population based on sample data. For example, a company might want to know if a new marketing strategy leads to higher sales than the old one.
There are two main types of hypotheses:
Null Hypothesis (H0): Assumes there is no effect or difference.
Alternative Hypothesis (H1 or Ha): Assumes there is an effect or difference.
Our goal is to determine whether the sample data provides enough evidence to reject the null hypothesis in favor of the alternative.
What is a One tailed test?
One tailed test looks for an effect in one direction. It is used when the alternative hypothesis is directional.
A one tailed test checks whether a sample mean is significantly greater than or less than a population mean or a specified value, but not both.
When to Use:
When you’re only interested in deviations in one direction.
Examples:
Testing if a new drug is more effective than the current one.
Checking if a machine produces items lighter than the standard weight.
Types:
Right Tailed Test: If we want to know whether the mean is greater than a certain value.
H0: μ ≤ μ0
Ha: μ > μ0
Left Tailed Test: If we want to know whether the mean is less than a certain value.
H0: μ ≥ μ0
Ha: μ < μ0
What is a Two tailed test?
A two tailed test checks for the possibility of an effect in both directions.
It evaluates whether the sample mean is significantly different from the population mean, either higher or lower.
When to Use:
- When you’re interested in any significant deviation, regardless of direction.
- Examples:
Testing if a new teaching method results in different test scores (could be higher or lower).
Verifying if a machine’s output weight is different from the standard.
Structure:
H0: μ = μ0
Ha: μ ≠ μ0
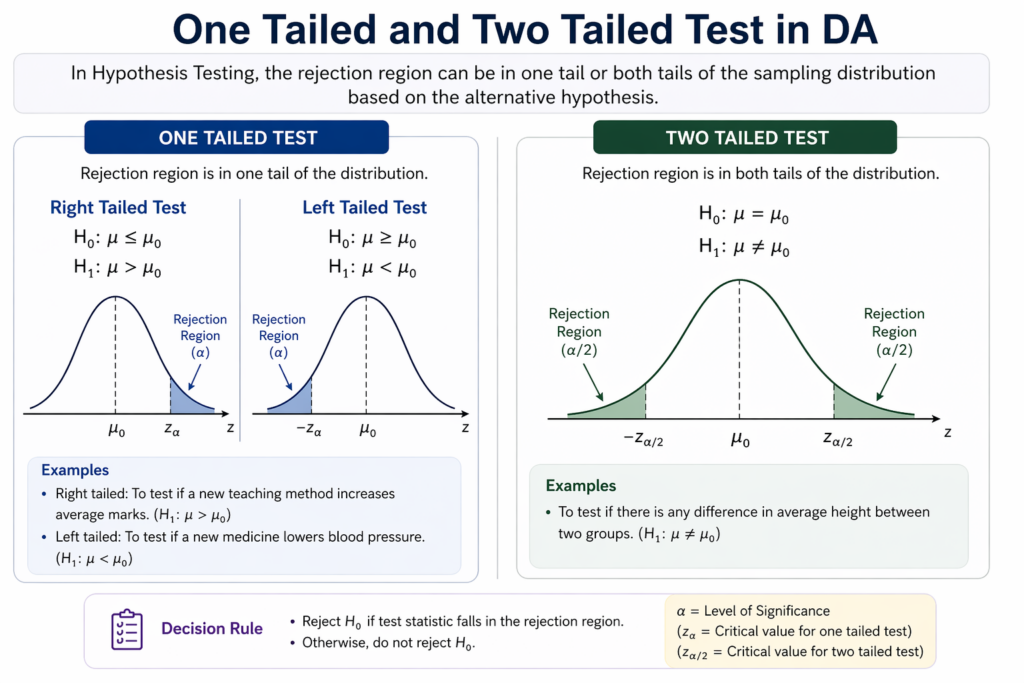
Visualizing the Difference
Imagine a bell shaped curve (normal distribution).
In a 1 tailed test, you only shade one tail (left or right), depending on your hypothesis.
In a 2 tailed test, you shade both tails because you’re testing for any extreme values in either direction.
This helps understand how the critical region (where we reject the null hypothesis) differs:
One-tailed test has the entire alpha level (e.g., 5%) in one tail.
Two-tailed test splits the alpha into 2.5% in each tail (if alpha = 5%).
One Tailed vs Two Tailed Tests
Important Questions to Ask:
Do I care about only one direction (greater or less)? → One-tailed
Do I care about any difference (greater or less)? → Two-tailed
Practical Tip for Testing:
Always define your hypotheses before looking at the data. Choosing a one-tailed test just to get significant results is considered bad practice.


Advantages and Disadvantages of One Tailed and Two Tailed Test
| Feature | One-Tailed Test | Two-Tailed Test |
|---|---|---|
| Simplicity | Easier to get significance in one direction | More balanced test |
| Flexibility | Less flexible (only one direction) | Tests for any difference |
| Acceptance | Less accepted in scientific journals | Widely accepted |
| Risk of Misuse | Higher, if chosen after seeing data | Lower, more conservative |
p-Values and Significance Levels
In a 1 tailed test, the p-value represents the probability in one tail.
In a 2 tailed test, the p-value includes both tails (it’s effectively doubled if the test was originally one-tailed).
For a significance level (α) of 0.05:
One tailed: Reject H0 if p < 0.05
Two tailed: Reject H0 if p < 0.025 in each tail (total 0.05)
Practical Implementation One Tailed and Two Tailed Test
Scenario:
A coffee shop claims that their average cup size is 300 ml. You collected a random sample of 10 cups and want to test if the actual average differs.
Your data (in ml):[290, 295, 305, 310, 300, 298, 299, 303, 297, 308]
Step By Step In Excel
2 Tailed Test (Is the mean ≠ 300 ml?)
- Entering the Data In Excel
290
295
305
310
300
298
299
303
297
308 Mean:
=AVERAGE(A1:A10)Standard Deviation:
=STDEV.S(A1:A10)Sample Size (n): 10
Standard Error (SE):
=B2/SQRT(10)t-statistic:
(Mean - 300)/SEDegrees of Freedom:
n - 1 = 9Two-tailed p-value:
=2*T.DIST.2T(ABS(t), 9)
1 Tailed Test (Is mean < 300 ml?)
Use:
=T.DIST(t, 9, TRUE)
Interpretation:
If p-value < 0.05, reject the null hypothesis.
2-tailed: Any significant difference.
1-tailed: Only test if it’s less than 300 ml.
Python Implementation
import scipy.stats as stats
import numpy as np

# Sample data
data = [290, 295, 305, 310, 300, 298, 299, 303, 297, 308]
mu = 300  # Claimed average

# One-sample t-test
t_stat, p_value_two_tailed = stats.ttest_1samp(data, mu)

# One-tailed p-value (less than 300)
p_value_one_tailed = p_value_two_tailed / 2 if t_stat < 0 else 1 - p_value_two_tailed / 2

print(f"Mean: {np.mean(data):.2f}")
print(f"Two-Tailed Test: t = {t_stat:.4f}, p = {p_value_two_tailed:.4f}")
print(f"One-Tailed Test (mean < 300): p = {p_value_one_tailed:.4f}")
-
Use 2-tailed if you’re checking for any difference.
-
Use 1-tailed if you want to test specifically if it’s less than 300.
Real Life Examples of One Tailed and Two Tailed Test
Example 1: Drug Effectiveness
Scenario: A pharmaceutical company wants to test if a new drug lowers blood pressure more than the existing one.
Test Type: One-tailed (we care only if it’s better, not worse).
Example 2: Manufacturing Tolerance
Scenario: A company checks if the average weight of a product is different from the required 500g.
Test Type: Two-tailed (too high or too low, both are issues).
Example 3: Employee Performance
Scenario: HR tests if a new training program has any effect (positive or negative) on productivity.
Test Type: Two-tailed
Conclusion:
Understanding one and two tailed tests is crucial in statistics and data analytics. The key is to match the test type with the research question. If your hypothesis is directional, go for a one tailed test. If it’s non directional, a two-tailed test is your best bet.
Always remember to define your hypotheses clearly, choose the right test before analyzing the data, and interpret results carefully. With these principles, you’ll be well-equipped to make data-driven decisions that are statistically sound.
Quick Recap:
One-tailed: Test for difference in one direction only
Two-tailed: Test for any difference
Choose based on your hypothesis, not the outcome
Whether you’re running A/B tests, checking product quality, or analyzing surveys, this understanding will make you a smarter, more reliable data analyst.
Frequently Asked Questions
Answer:
A one tailed test is a hypothesis test where the critical region lies in only one direction. It checks whether a parameter is either greater than or less than a specific value. This type of test is used when the research has a clear directional assumption. It provides more power to detect an effect in that direction.
Answer:
A two tailed test evaluates whether a parameter is significantly different from a given value in either direction. It considers both the left and right sides of the distribution. This makes it more flexible when no specific direction is assumed. It is commonly used in general hypothesis testing.
Answer:
The main difference lies in the direction of the test. A one tailed test focuses on one side, while a two tailed test checks both sides of the distribution. One tailed tests are more specific, while two tailed tests are more conservative. The choice depends on the research objective.
Answer:
A one tailed test is used when you are only interested in a specific direction of change. For example, when testing if a value increases or decreases. It is useful when prior research supports a directional hypothesis. This helps in making focused conclusions.
Answer:
A two tailed test is used when any difference from the expected value matters. It is suitable when you do not know the direction of change. This approach is more cautious and widely accepted in research. It ensures that both possibilities are considered.
Answer:
Yes, a one tailed test is generally more powerful in detecting an effect in one direction. This is because the significance level is concentrated on one side. However, it cannot detect effects in the opposite direction. So, it should only be used when direction is certain.
Answer:
A one tailed test can be used to check if a new method improves performance. A two tailed test can be used to check if there is any difference in results. These tests are widely used in business, research, and quality analysis. They help in making data-driven decisions.
Answer:
Data analytics courses are programs that teach how to analyze and interpret data effectively. They include topics like data cleaning, visualization, and statistical analysis. These courses focus on practical skills using real-world datasets. They are designed to prepare learners for analytics roles.
Answer:
These courses teach data handling, visualization, and problem-solving skills. Learners also gain knowledge of tools used for analyzing large datasets. Practical projects help in applying concepts to real scenarios. This builds strong analytical thinking abilities.
Answer:
Yes, they are valuable for building a career in a growing field. They provide structured learning and hands-on experience. These courses help improve job opportunities and skill development. With consistent practice, they can lead to strong career growth in analytics.

