
Unsupervised Learning
What do you mean by Unsupervised learning ?
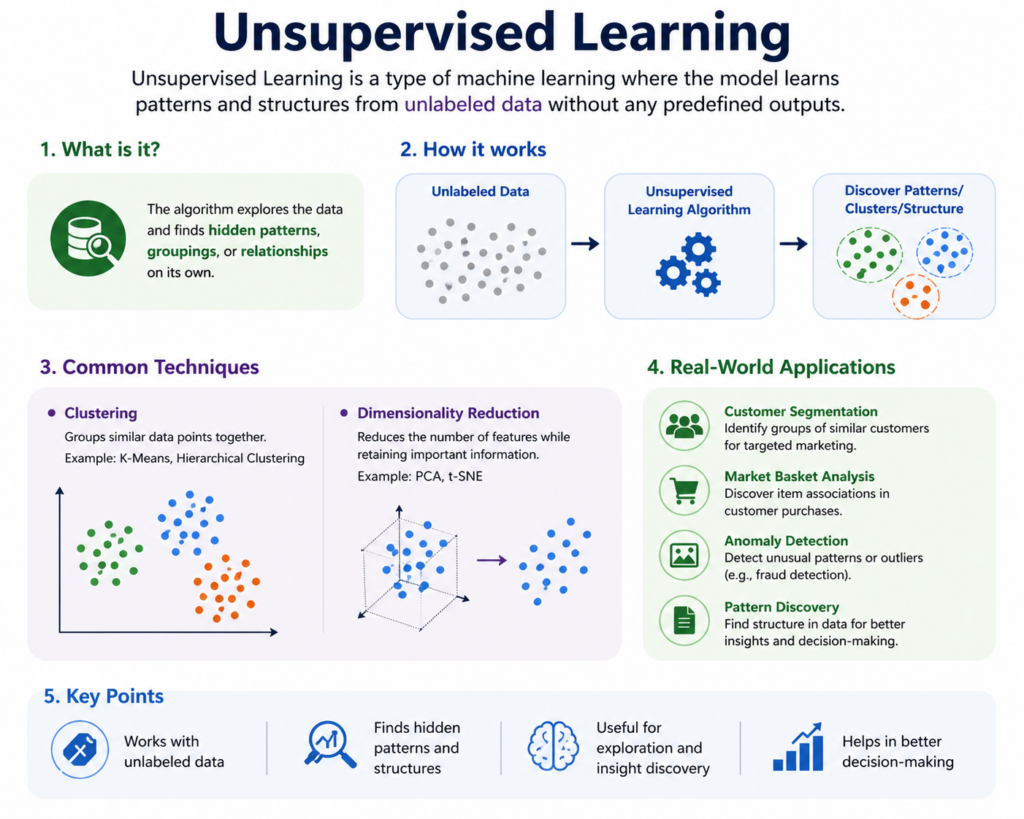
Unsupervised Learning is a type of machine learning where the model learns from data without labels. It finds patterns, groups, or structures in the data on its own.
It is used in areas like customer segmentation, recommendation systems, anomaly detection, and data compression. With techniques like clustering and dimensionality reduction, it helps in exploring and understanding unknown data.
In this article, we will look at how Unsupervised Learning works, its main ideas, and why it’s useful when labeled data is not available.

Understanding the concept of Unsupervised Learning
Unsupervised learning is a vital branch of machine learning where the algorithm is used to identify hidden patterns or intrinsic structures in input data without any labeled outcomes.
Unlike supervised learning, which requires labeled data, unsupervised learning deals with unlabeled data and allows systems to classify, group, or summarize information based only on input features.
This method is widely used in applications such as customer segmentation, anomaly detection, pattern recognition, and data compression.
It empowers machines to discover the underlying structure in data without human intervention, making it a powerful tool in data analytics and AI.
The primary objective is to explore the data and identify patterns, such as grouping similar data points together or reducing the dimensionality of the dataset while preserving key information.
With unsupervised learning, you can automatically segment these customers into distinct groups based on similar characteristics without knowing in advance what those groups should be.
Concepts in Unsupervised Learning
Unlabeled Data: Unlike supervised learning, there is no output label associated with the input data.
Clustering: Grouping similar data points into clusters based on shared features.
Dimensionality Reduction: Reducing the number of features while retaining essential data characteristics.
Feature Extraction: Identifying and extracting meaningful features from raw data.
Anomaly Detection: Identifying data points that do not conform to the general pattern.
Types of Unsupervised Learning
1. Clustering
This technique groups similar items together based on certain characteristics.
Common Clustering Algorithms:
K-Means Clustering: Partitions data into K distinct clusters.
Hierarchical Clustering: Builds a hierarchy of clusters using a tree-like structure.
DBSCAN (Density-Based Spatial Clustering): Groups points that are closely packed and identifies outliers.
Applications:
Market segmentation
Grouping search results
Organizing computing clusters
2. Dimensionality Reduction
Reduces the number of variables under consideration while maintaining essential patterns.
Popular Techniques:
Principal Component Analysis (PCA)
t-Distributed Stochastic Neighbor Embedding (t-SNE)
Autoencoders (Neural networks used for reducing dimensionality)
Applications:
Data visualization
Noise reduction
Improving model performance

Advantages of Unsupervised Learning
No Need for Labeled Data: Saves time and resources as labeling large datasets is expensive and time-consuming.
Discovers Hidden Patterns: Can reveal unexpected structures or insights from raw data.
Scalable and Flexible: Suitable for exploring vast and complex datasets.
Supports Exploratory Data Analysis: Great for getting an initial understanding of data.
Disadvantages of Unsupervised Learning
Less Accurate than Supervised Learning: Without labels, it’s hard to evaluate accuracy or validate the results.
Complex Interpretation: Clusters or reduced dimensions may not always make sense or be clearly labeled.
Requires Assumptions: Algorithms like K-Means require assumptions (like the number of clusters) that may not be obvious.
Sensitive to Scaling and Noise: Performance can drop if the data is not properly preprocessed.

Some Common Unsupervised Learning Algorithms
1. K-Means Clustering
Divides data into K clusters based on feature similarity.
Works by minimizing the variance within each cluster.
2. Hierarchical Clustering
Builds nested clusters by either merging or splitting them successively.
Does not require the number of clusters to be specified upfront.
3. DBSCAN
Groups together closely packed points and marks points in low-density regions as outliers.
Useful for discovering clusters of arbitrary shape.
4. Principal Component Analysis (PCA)
A statistical method used to emphasize variation and bring out strong patterns in a dataset.
Helps reduce the number of variables.
5. Autoencoders
A type of neural network used to learn efficient codings of unlabeled data.
Often used for noise reduction and dimensionality reduction.
Steps in Unsupervised Learning
1. Data Collection
Goal:
Gather enough raw data related to the problem you want to solve.
Details:
Data doesn’t have labels or target variables.
Data can come from sources like databases, IoT devices, web scraping, sensors, logs, etc.
Tools:
SQL, Python (Pandas), APIs, Web Scraping libraries (e.g., BeautifulSoup)
Example:
Collecting product purchase history of users from an e-commerce platform.
2. Data Preprocessing
Goal:
Prepare the raw data for analysis by cleaning and transforming it.
Details:
Cleaning: Handle missing values, remove duplicates, fix errors.
Encoding: Convert categorical data to numeric (if required).
Scaling/Normalization: Make features comparable (e.g., age and income).
Outlier Detection: Remove extreme values that may skew results.
Tools:
Python libraries: Pandas, NumPy, Scikit-learn (StandardScaler, MinMaxScaler)
Example:
Normalize income values so that they don’t dominate other features like age or spending.
3. Algorithm Selection
Goal:
Choose an unsupervised algorithm that fits the goal of your task.
Types of Problems & Algorithms:
Clustering – Group similar data points
Algorithms: K-Means, Hierarchical Clustering, DBSCAN
Dimensionality Reduction – Reduce features while preserving structure
Algorithms: PCA, t-SNE, UMAP
Association Rule Learning – Discover interesting relationships in data
Algorithms: Apriori, FP-Growth
Example:
Use K-Means to segment customers into groups based on behavior.
4. Model Training
Goal:
Let the algorithm find hidden patterns or structure in the data.
Details:
No labels are provided; the model works only on features.
The algorithm tries to group or compress data based on similarity or distribution.
Often involves setting hyperparameters (e.g., number of clusters in K-Means).
Example:
K-Means groups customers into 4 segments based on age, income, and shopping frequency.
5. Visualization & Interpretation
Goal:
Understand what the model learned through visual tools and metrics.
Tools:
Matplotlib, Seaborn for 2D plots
Plotly, Bokeh for interactive graphs
Dimensionality Reduction (PCA or t-SNE) to reduce high-dimensional data to 2D or 3D
Metrics (if applicable):
Silhouette Score
Dunn Index
Davies-Bouldin Score
Example:
Use PCA to visualize clusters on a 2D scatter plot and check how well-separated the groups are.
6. Refinement and Tuning
Goal:
Improve the model’s performance or interpretability.
Steps:
Tune parameters (e.g., K in K-Means, epsilon in DBSCAN)
Try different algorithms and compare results
Validate stability of clusters using multiple runs
Use domain knowledge to interpret patterns (e.g., naming customer segments)
Example:
Increase the number of clusters in K-Means to better match business-defined customer personas.
Final Outcome:
A model that can reveal hidden groups, trends, or structures, and provide insights for decision-making, personalization, automation, or data compression.
Evaluation Methods for Unsupervised Learning
Evaluating unsupervised models is more difficult than supervised learning because we usually don’t have labels to compare against. However, there are several metrics and methods to judge how well the model has grouped or structured the data:
1. Silhouette Score
What it does:
Measures how similar each point is to its own cluster compared to other clusters.
How it works:
Score ranges from -1 to 1
Close to 1 = well clustered
Around 0 = overlapping clusters
Less than 0 = likely in the wrong cluster
When to use:
Good for evaluating clustering algorithms like K-Means.
2. Davies-Bouldin Index
What it does:
Measures how compact each cluster is and how separated the clusters are from each other.
How it works:
Lower score = better clustering
Looks at the ratio of within-cluster distance to between-cluster distance
When to use:
Helpful when you want to balance intra-cluster similarity and inter-cluster separation.
3. Cluster Purity
What it does:
Compares the clusters to true labels, if available afterward, to see how “pure” they are.
How it works:
Measures the dominant class in each cluster
Purity = (correctly classified points) / (total points)
Score between 0 and 1, where 1 is perfect
When to use:
Only when ground truth labels are available post hoc (e.g., for evaluation or benchmarking).
Other Evaluation Methods (Optional)
Elbow Method: Helps decide the number of clusters by plotting within-cluster variance vs. number of clusters.
Dunn Index: Similar to Davies-Bouldin but focuses more on compactness and separation.
Visual Inspection: Use dimensionality reduction (like PCA or t-SNE) to visually assess clustering results.
Tools and Libraries
Scikit-learn: Python library offering a range of unsupervised algorithms like K-Means, PCA, DBSCAN.
TensorFlow/Keras: Useful for building deep unsupervised models like autoencoders.
Matplotlib and Seaborn: For visualizing clusters and data structure.
Pandas and NumPy: For preprocessing and handling large datasets.
Unsupervised Learning Best Practices
Scale Your Data: Many algorithms perform better with normalized or standardized data.
Try Multiple Algorithms: Compare different methods for best clustering or reduction results.
Use Domain Knowledge: Understanding the context helps interpret clusters and patterns meaningfully.
Visualize Data: Use t-SNE or PCA plots to understand structure.
Test Sensitivity: Evaluate how results change with different parameters (e.g., number of clusters).
Real World Applications of Unsupervised Learning
1. Customer Segmentation
Businesses use unsupervised learning to group customers by purchasing behavior, preferences, or demographics, allowing for personalized marketing strategies.
2. Anomaly Detection
Used in fraud detection and network security, it helps identify unusual data patterns that may indicate suspicious activity.
3. Recommendation Systems
Helps platforms like Netflix or Amazon suggest products or movies based on user behavior and grouping similar users/items.
4. Pattern Recognition
Used in image and speech recognition to identify patterns in visual or audio data without predefined labels.
5. Data Compression
Compresses high-dimensional data into simpler formats while retaining essential information, useful for storage and transmission.
Conclusion:
Unsupervised learning offers a powerful approach for discovering hidden patterns and structures in unlabeled data. It is an essential technique in the data scientist’s toolkit, especially when labeled data is scarce or unavailable. From customer segmentation to anomaly detection, unsupervised learning provides insights that drive business decisions, enhance user experiences, and improve system performance.
As AI continues to evolve, combining unsupervised learning with supervised and reinforcement learning can lead to more intelligent and autonomous systems. By mastering unsupervised learning techniques, analysts and engineers can unlock deeper value from their data and build systems that truly learn from the world around them.
Frequently Asked Questions
Answer:
Unsupervised Learning is a type of machine learning where algorithms analyze and group unlabeled data without predefined outcomes. It identifies hidden patterns, structures, and relationships within datasets. This approach is widely used in data exploration, clustering, and dimensionality reduction tasks.
Answer:
The two primary types of unsupervised learning are clustering and association. Clustering groups similar data points together, while association finds relationships between variables. Techniques like K-means clustering and Apriori algorithm are commonly used in these categories.
Answer:
Unsupervised learning works by feeding raw, unlabeled data into algorithms that detect patterns based on similarities or differences. The model organizes data into meaningful groups or structures. It relies on statistical techniques rather than predefined labels to generate insights.
Answer:
Unsupervised learning is beneficial because it does not require labeled data, saving time and cost. It helps uncover hidden patterns and insights that may not be obvious. It is also useful for exploratory data analysis and preprocessing for supervised models.
Answer:
Unsupervised learning is used in customer segmentation, recommendation systems, fraud detection, and anomaly detection. Businesses use it to understand user behavior and improve personalization. It is also applied in image compression and natural language processing.
Answer:
The key difference lies in data labeling. Supervised learning uses labeled data to predict outcomes, while unsupervised learning works with unlabeled data to find patterns. Unsupervised learning is more exploratory, whereas supervised learning is goal-oriented and predictive.

