
Types of Data in Statistics
Types of Data in Statistics for Data Analytics
Types of data in statistics for data analytics define how data is categorized, analyzed, and interpreted to generate meaningful insights. In data analytics, understanding data types is essential because it directly impacts how data is collected, processed, visualized, and used in decision making.
From numerical datasets used in predictive modeling to categorical data used in segmentation, data types form the foundation of statistical analysis.

What is Data?
Data refers to the collection of numbers, characters, images, or other forms of information that can be organized and analyzed.
- In statistical terms, data is primarily numerical and is used to gain insights through various analytical methods.
- For example, a set of numbers like 12, 19, 17, and 15 represents data that can be studied to uncover trends or patterns
What are Types of Data in Statistics?
In statistics, data is classified into different types based on its nature and characteristics. This classification helps analysts choose the right statistical methods and tools for analysis.
Broadly, data is divided into:
- Qualitative (Categorical) Data
- Quantitative (Numerical) Data
Understanding these types is crucial for performing accurate data analysis.
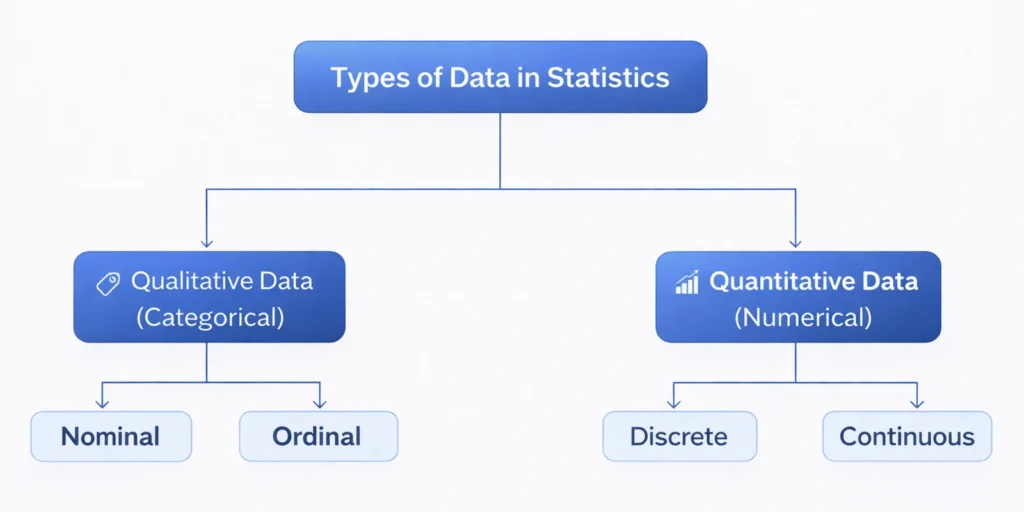
1. Qualitative Data (Categorical Data)
Qualitative data represents non-numerical information that describes characteristics or categories.
Types of Qualitative Data:
1. Nominal Data: Represents categories without any order and that cannot be ranked.
Examples:
- Gender
- Color
- Country
2. Ordinal Data: Represents categories with a meaningful order and differences between values are not measurable.
Examples:
- Customer satisfaction (Low, Medium, High)
- Education level
2. Quantitative Data (Numerical Data)
Quantitative data represents numerical values that can be measured and analyzed mathematically.
Types of Quantitative Data:
1. Discrete Data: Countable and finite values and usually whole numbers.
Examples:
- Number of students
- Number of products sold
2. Continuous Data: Measurable values within a range and we can take any value (including decimals)
Examples:
- Height
- Weight
- Temperature
Difference between Data Types in Data Analytics
| Feature | Qualitative Data | Quantitative Data |
|---|---|---|
| Nature | Non numerical | Numerical |
| Analysis | Categorization | Mathematical analysis |
| Examples | Gender, Color | Height, Age |
| Subtypes | Nominal, Ordinal | Discrete, Continuous |
Importance of Data Types in Data Analytics
Understanding data types is critical because:
- Helps choose the correct statistical methods
- Improves data cleaning and preprocessing
- Enables accurate data visualization
- Supports better decision making
- Ensures correct use of tools like Python and SQL
Incorrect data classification can lead to wrong insights and poor analysis.

Types of Data in Real World Data Analytics
1. Business Analytics
- Customer categories (qualitative)
- Sales numbers (quantitative)
2. Healthcare
- Patient type (categorical)
- Blood pressure (continuous)
3. Finance
- Transaction counts (discrete)
- Market prices (continuous)
4. Marketing
- User segments (nominal)
- Survey ratings (ordinal)
Data Types in Analytics Tools
Data Types in Analytics Tools:
- Python: Pandas supports categorical and numerical data and NumPy handles numerical computations.
- SQL: Data types: INT, FLOAT, VARCHAR
- Excel: Numbers, text, and date formats
- Power BI & Tableau: Used for visualizing different data types effectively
Role of Data Types in Exploratory Data Analysis (EDA)
In EDA, data types help:
- Identify patterns and trends
- Choose appropriate charts (bar, histogram, scatter plot)
- Detect outliers and anomalies
- Prepare data for modeling
Conclusion….
Understanding the types of data in statistics for data analytics is essential for performing accurate and meaningful analysis.
- Proper classification into qualitative and quantitative data allows analysts to choose the right statistical methods, apply suitable visualization techniques, and derive reliable insights.
- It also plays a crucial role in data preprocessing, exploratory data analysis, and building predictive models.
- By mastering data types, analysts can improve data accuracy, avoid misinterpretation, and make better data driven decisions across domains like business, healthcare, finance, and marketing.
Ultimately, a strong foundation in data types is a core requirement for anyone working in data analytics and serves as a stepping stone toward advanced concepts like machine learning and artificial intelligence.

Frequently Asked Questions
Answer:
The main types of data are qualitative (categorical) and quantitative (numerical). Qualitative data includes nominal and ordinal types, while quantitative data includes discrete and continuous data.
Answer:
Data types are important because they determine how data is processed, analyzed, and visualized. Proper classification ensures accurate insights and better decision making.
Answer:
Qualitative data represents categories or labels, while quantitative data represents numerical values that can be measured and analyzed mathematically.
Answer:
Discrete data includes countable values like number of students, while continuous data includes measurable values like height, weight, and temperature.
Answer:
Data types are used in business, healthcare, finance, and marketing to analyze trends, segment users, and make data driven decisions.
Answer:
Tools like Python, SQL, Excel, Power BI, and Tableau support different data types for analysis, processing, and visualization.

